
BTCUSD (Bitstamp)
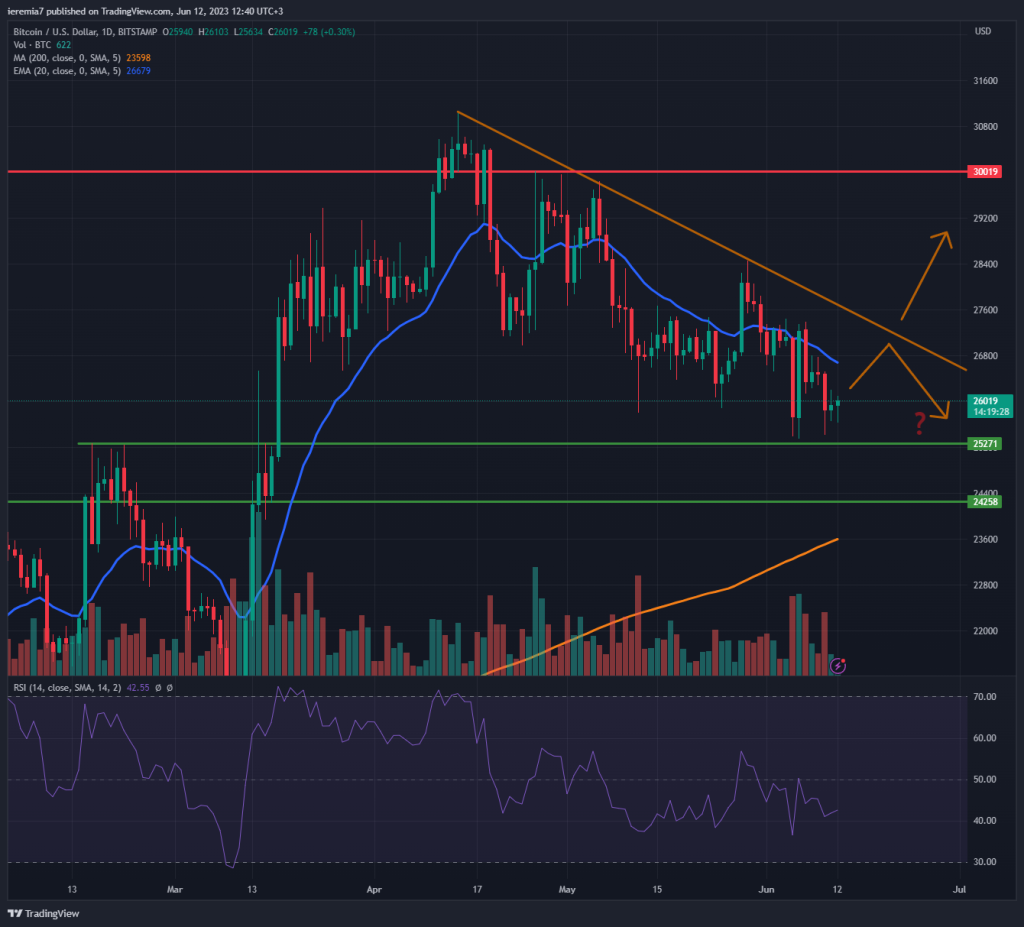
Last week has been bearish for Bitcoin and the broader market as the US SEC started an investigation on Coinbase and Binance, two of the largest exchanges. Because of that, it should be no surprise to see the market continued to treat the daily 20 EMA as overhead resistance. We see some short-term buying interest near $25,000, but thus far, it’s not enough to suggest the leg lower has ended.
We are entering a major week in terms of news, with several central banks poised to announce monetary policy decisions. The USD and interest rates could become volatile and that had an impact on crypto in the past. Technically, BTC is trapped below a trend line and only if it manages to break above, should we expect a bounce towards $30,000.
Else, we think there’s scope for further selling towards $25,000 and $24,200. Also, be aware that the daily 200 SMA is rising and could be treated as a potential target by sellers. The RSI is not giving us any overbought/oversold signals, so the market can go either way this week.
ETHUSD (Kraken)
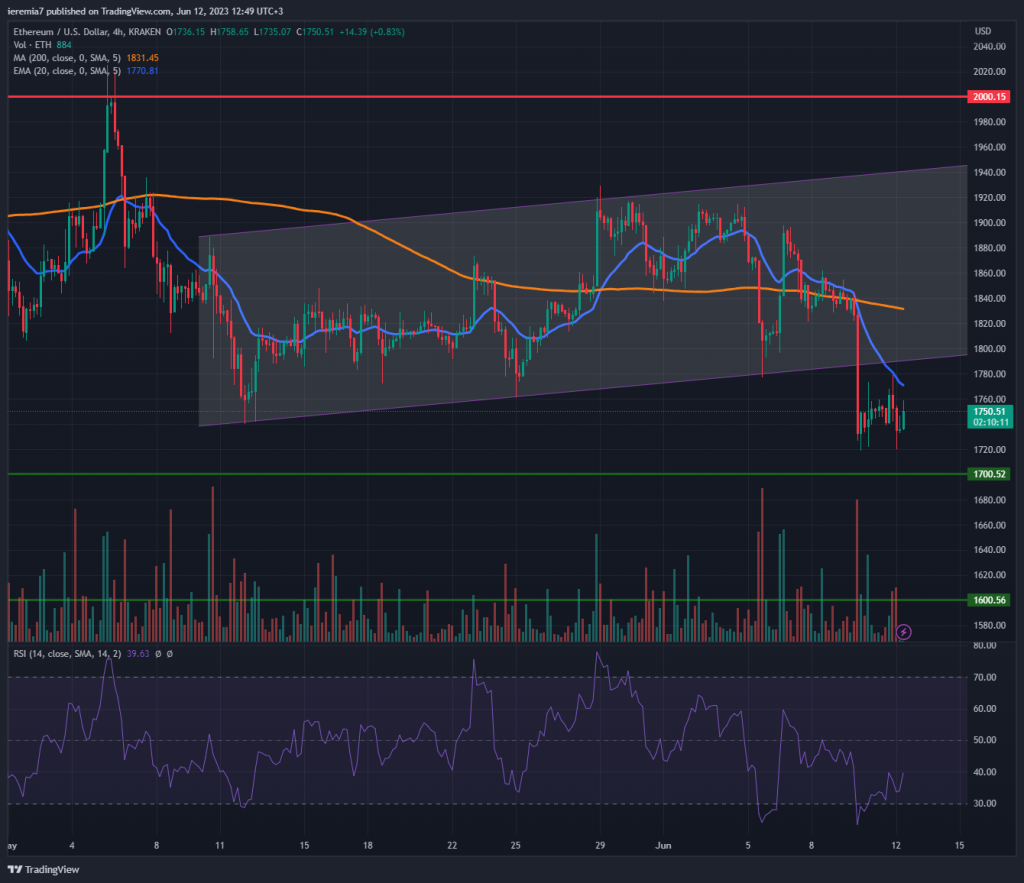
Ether broke below a short-term ascending channel we’ve mentioned in a previous analysis and as expected, the price is consolidating in a narrow range after the break. That was an important technical development and now market participants are waiting for further clues on where the price might be headed.
There’s scope for a retest of $1,700, a key support area where buyers might want to increase their exposure and sellers take profit after a decent move lower. If that won’t be enough to contain the selloff, then $1,600 will grab the market’s attention.
Based on current conditions, the bullish scenario is less likely. However, if we start to see ETH break above the 20 EMA on the 4h chart and back inside the channel, some further gain should follow suit. Be aware of “sell the rips” scenarios.
SOLUSD (Coinbase)
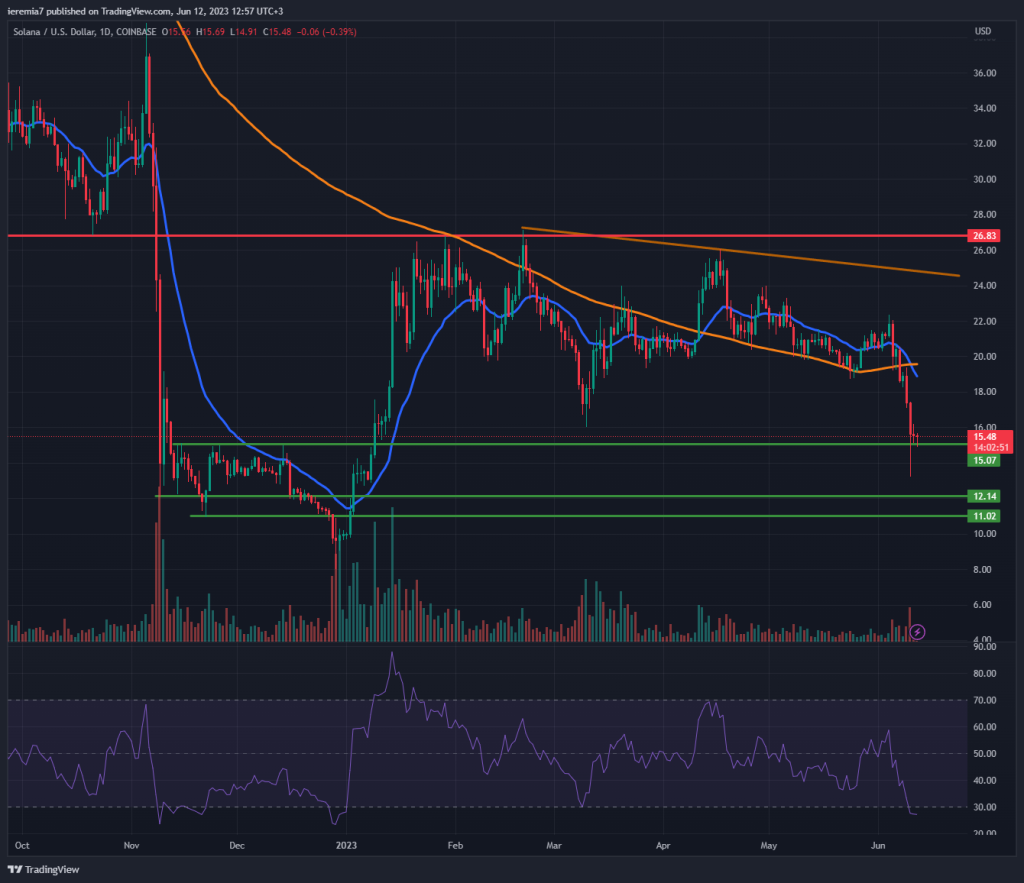
Solana tanked 28% last week as altcoins were the most hit. However, the selling seems to be exhausted on the daily chart, despite the breakout below the 200 SMA. The market stalled around $15, an important role reversal level and support, so if the sentiment starts to improve, we should start to see bears squeezed out of the market.
The corrective move could head towards $18 and if the buyers drive SOL above the 200 SMA, we expect a larger move that can extend until $26. This might be a larger bottoming formation and eventually, all these losses will be wiped out.
However, if we see more selling this week and $12 or $11 fail to act as support, that won’t be an encouraging sign. The market should stabilize around the current area and then buyers need to come in and prop the price up. Solana had been trading choppy since the beginning of the year, but that could be an early indication things might smoothen out for the coin sooner or later.


There are no comments at the moment, do you want to add one?
Write a comment