BTCUSD Coinbase
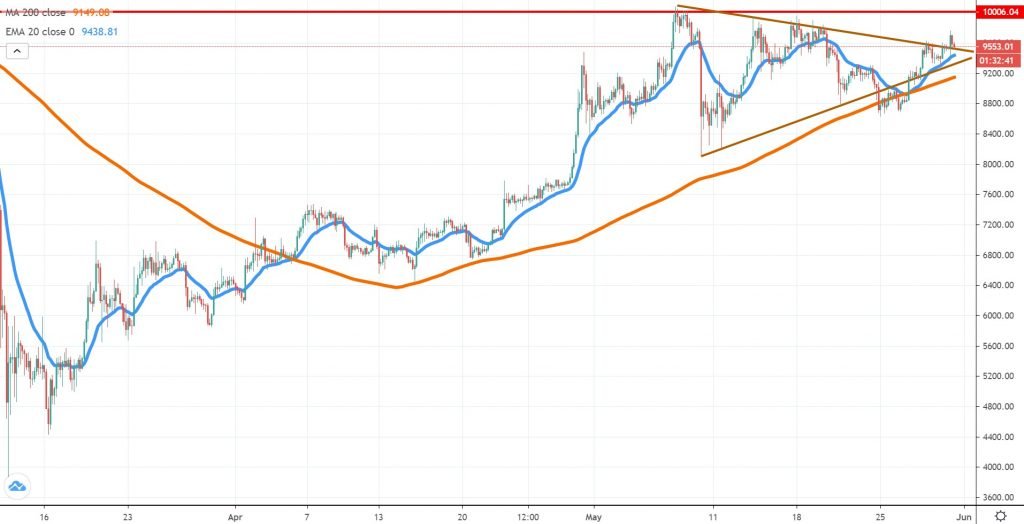
The triangle formation we’ve talked about in the future is almost filled and just a few hours ago the buyers managed to break above it. However, there’s no follow-through buying for now, which means this could also be a false break or fakey. Traders should watch how the price action will react to the 20 EMA or the 200 SMA on the 4h chart because those are two areas where the buyers had stepped in recently.
As long as the price will continue to trade above the triangle, our view is bullish and a retest of the $10,000 area looks imminent. More than that, we suspect a break above the May 8th high should occur and $10,500 will be next.
We’re during the weekend right now and liquidity is thin, which means the breakout is not backed by huge volumes. In case the price will break back inside the triangle, watch whether buyers will react to the above-mentioned two MAs. If they don’t we might be up for a deeper corrective move lower.
ETHUSD Kraken
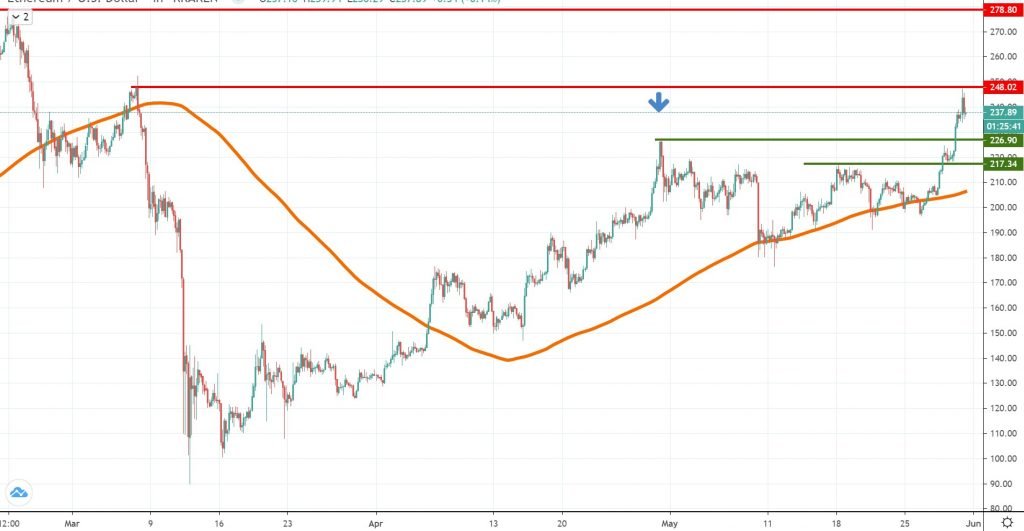
If Bitcoin had continued to trade sideways, Ether had continued to outperform and already broke above the April 30th high, a major achievement for the bulls. As it should have been expected, some profit-taking had emerged around $248, which is where impulsive selling began on March 7th. Still, the bigger picture is favoring the upside, since we have a nice bullish parabolic structure in play.
Buyers looking to get long could wait for a retest of the $225 area, which is where the April 30th high was located. We think the market will treat it as support from now on, but if it doesn’t more support will follow around $220 or the 4h chart 200 MA.
On the upside, we think buyers will continue to pressure the $248 area and that will raise the odds of a continuation higher. Above that zone, there more upside potential until the $278 key resistance area.
BCHSVUSDT Poloniex
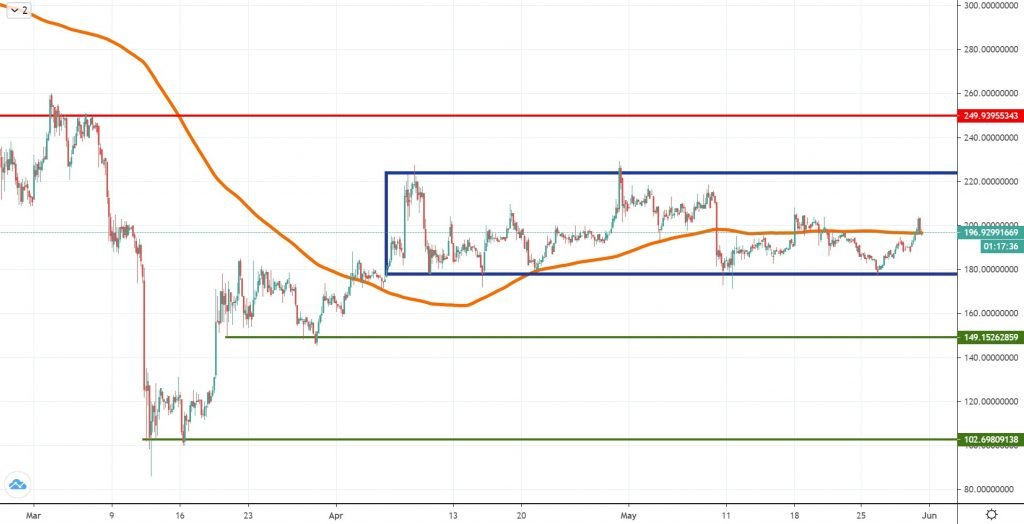
Since April 6th, Bitcoin SV is locked inside a range between $180 and $225, and so far neither bulls or bears managed to stage a significant breakout. Considering the market had respected the area so accurately, we think it would be wise to play both sides of the range until a break will occur. Right now, the price is hovering around the 4h chart 200 MA, and on a break above, we should expect a retest of the upper line of the channel.
In case a break above will finally occur, we believe the price will continue towards the $250 key resistance area and psychological level. If the range will remain in place, then a new leg lower will start to unfold. It’s important to monitor the price action and notice whether there are subtle changes in behavior. When either market side will start to show weakness, that would be an early indication that an imbalance in the order flow will start and that’s when the next impulsive move will unfold.


There are no comments at the moment, do you want to add one?
Write a comment