BTCUSD Coinbase
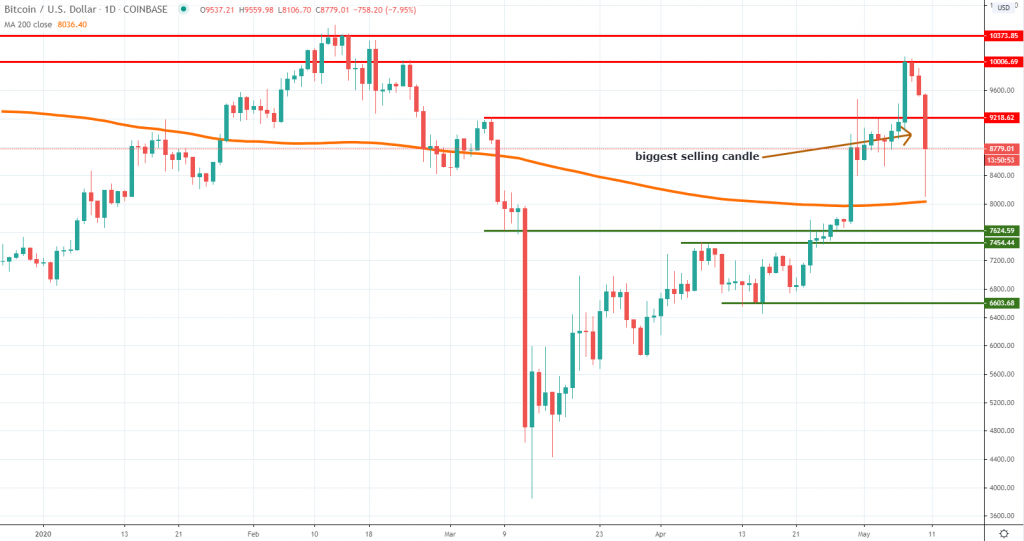
Even though Bitcoin started the week in an upbeat tone, the last three days show the bullish momentum is fading, as the halving is priced in and buyers are taking profits. The price had found resistance around the psychological $10,000 area and since then it dropped around $2,000. Some buying interest emerged near the daily 200 moving average, but the Sunday candle marks the biggest selloff since March 12th.
That’s not good news for enthusiastic buyers believing Bitcoin will continue higher impulsively. We’re about two days before the halving takes place and we suspect further selling will follow before buyers start a new impulsive leg on the upside. Watch how the price will react around the 200 MA and around the $7,500 area. A break below will open more room towards $6,600.
On the other hand, sellers could rejoin the market if the price gets back to the $9,200 area. Selling on short-term rallies could be the best approach in the next few days as the market will need new reasons to pile up on Bitcoin.
ETHUSD Kraken
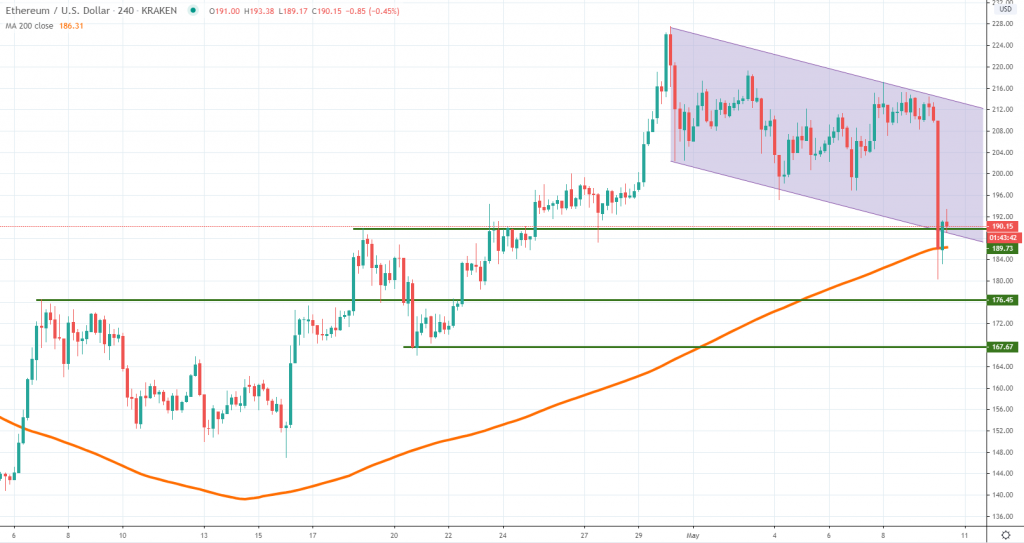
The Bitcoin weakness had influenced the broad market sentiment and pushed Ether below the $200 area. After topping on April 30th, Ether had been under pressure since then and we have managed to spot a short-term consolidation channel. On one hand, that could be good news for buyers longer-term, since the current selling could only be a break before a new leg higher.
We can notice had the lower line of the channel backed by the 4h chart 200 moving average acted as support and contained the selloff. As long as the price remains inside the channel, a surge back above $200 is not excluded. The upper line of the channel stands around $212, but it will depend on how fast the price would climb.
On the other hand, breaking below the channel and the MA will be a major bearish sign. If that will take place, we expect $176 and $167 to act as potential support areas. A big bear candles stand out on the 4h chart and the next few days will show if it’s an exhaustion or a sign for increased bearishness.
BCHABCUSDT Bittrex
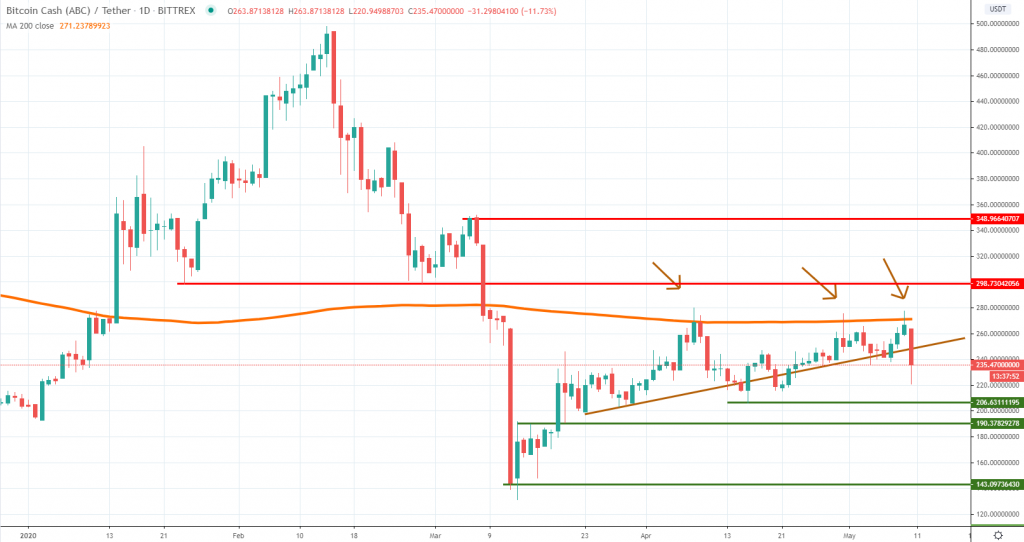
Bitcoin Cash (ABC) had been gradually recovering since March 12th, but as we can notice from the chart, the price action had been rejected by the daily 200 MA three times of the past few weeks. That communicates there is increased selling interest and the last candle only confirms sellers had resumed with strength.
Looking forward is the downside will extend below the short-term ascending trend line, we expect BCH to edge towards the $200 area and potentially revisit the March lows in the mid-term horizon.
On the flip side, a breakout above the daily 200 MA will mean $298 and $348 will become the next upside targets and will suggest the bullish parabolic structure had not been negated yet. How the price will behave over the next few days should indicate who’s in control over the order flow.


There are no comments at the moment, do you want to add one?
Write a comment