
BTCUSD Coinbase
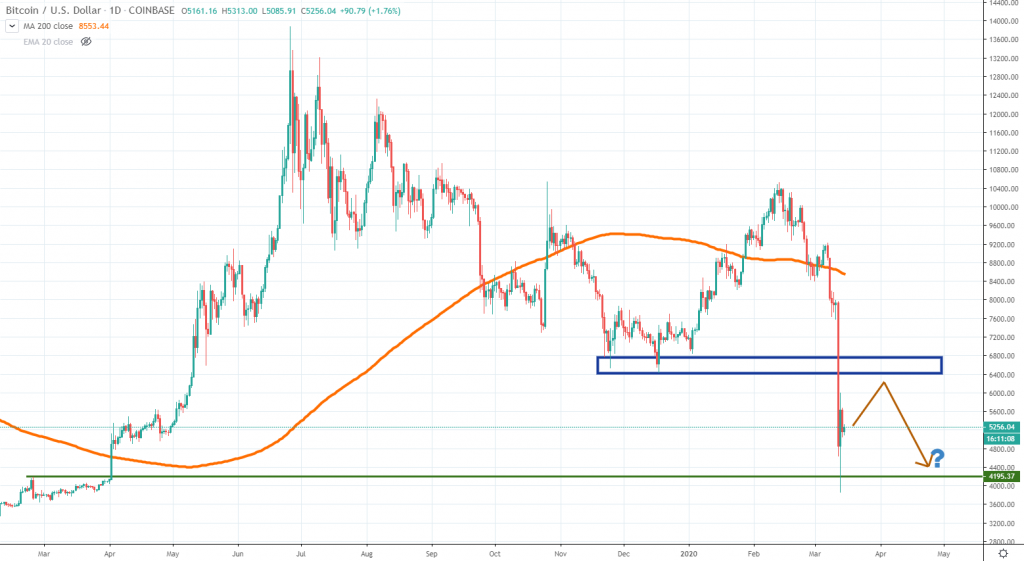
Bitcoin had not managed to hold the high valuation as the entire financial system continues to edge south during the past week. The price dipped more than 50% on the Coinbase exchange, as investors rushed into cash. Unfortunately, the move was so impulsive that it drove Bitcoin below the December 2019 lows, all the way to the $4,000 area where buyers stepped in.
In the short-term, we expect the price to bounce higher following the massive selloff, but the upside might be capped by the area around the December 2019 lows. Sellers could regard $6,400- $6,800 as a new opportunity to get short. Only an impulsive breakout above that area could raise some positive prospects, but right now, the overall picture had deteriorated meaningfully.
Longer-term, sellers had regained control over the order flow, and we suspect the $4,000 area could be retested again in a matter of weeks. If selling resumes, though, it’s not excluded to see Bitcoin edge even lower. Everything will depend on how the risk appetite will change next week.
ETHUSD Kraken
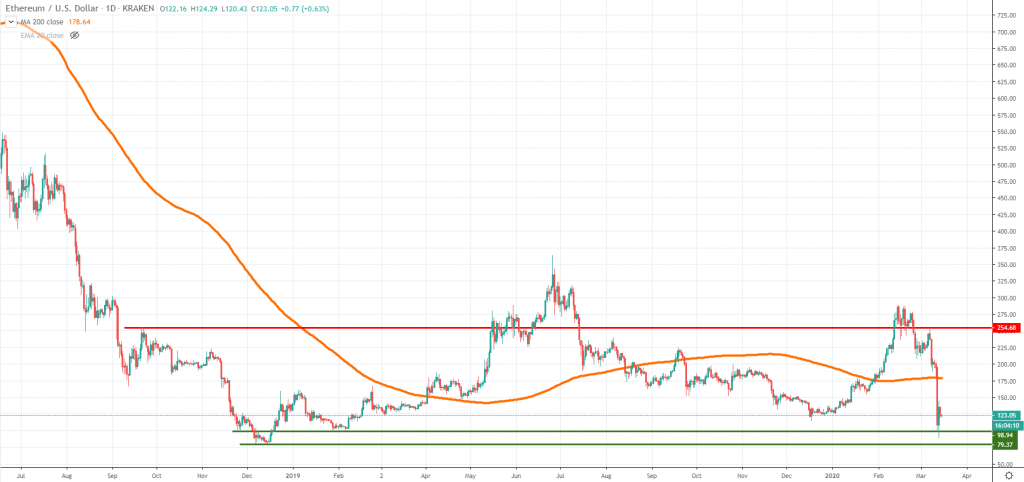
Ether had also erased all the 2020 gains and was close to retesting the December 2018 lows. Looking at the daily chart, we can notice the largest selling candle had appeared three days ago and it was followed by a bounce higher.
Could it be an exhausted selling or just a confirmation that the bear market is doomed to continue? Right now, it’s impossible to predict, but it will be important to see whether the area around $79-$98 will manage to hold as support. If it does, that will show Ether is still range bound and will start a new leg higher. Our chart shows how the price had been locked in a range since September 2018.
On the other hand, breaking below the 2018 lows, followed by weak buying interest will be a bearish sign for Ether and could mean the psychological $50 area will be next to be tested.
XRPUSD Kraken
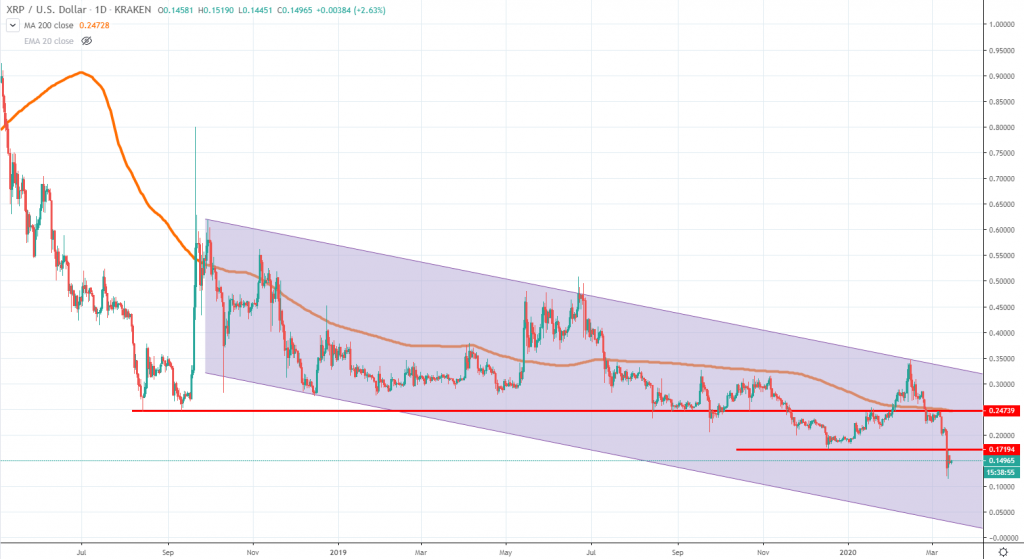
The XRP selloff accelerated during the past week and the price broke below the 17 cents area, which is where it bottomed in December 2019. Looking at the bigger picture, things aren’t encouraging for XRP, since the large-cap token continues to be a major underperformer.
It seems like the price trades inside a bearish channel and if the selling will continue, we could see XRP trading around 5 cents in a matter of weeks. That’s the most bearish scenario right now and things could change in the meantime.
On the positive side, buyers will need to overcome the 17 cents area, now acting as resistance, and then the area around 24 cents, which is where the daily 200 moving average is also located. Although the picture is bearish for XRP right now, the price is expected to bounce impulsively, same as it did several times over the past year and a half. The key will be to track precisely how the risk sentiment will continue to evolve.


There are no comments at the moment, do you want to add one?
Write a comment