
BTCUSD Coinbase
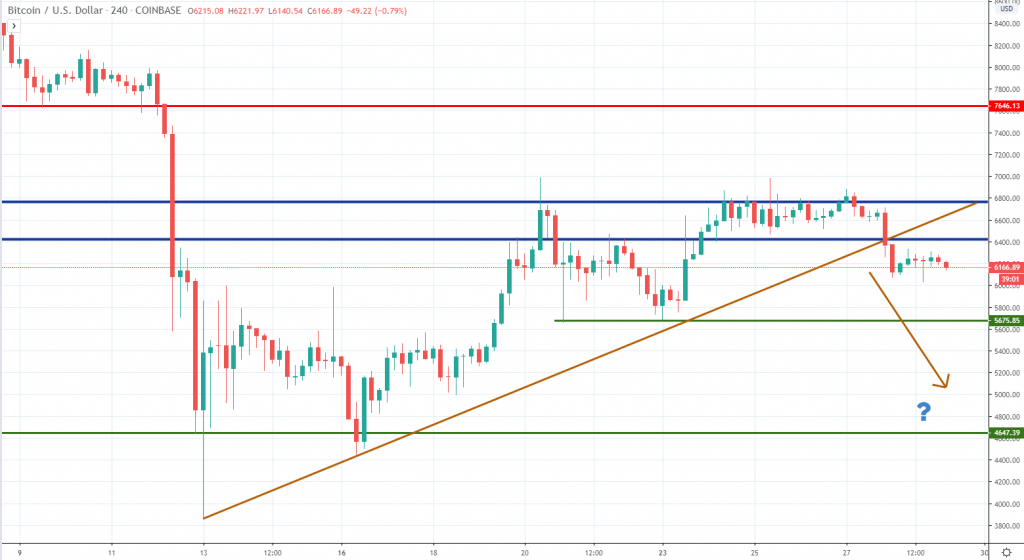
As we’ve anticipated in our last weekly crypto analysis, the price of Bitcoin did not manage to break above the $6,400 – $6,800 resistance area and since a few days ago it started to head south again. Breaking below a short-term ascending trend line is another key technical development, suggesting that sellers are again in control over the order flow.
Our next downside target stands around $5,600, where two short-term lows are being located. An acceleration lower will send Bitcoin towards the $4,500 area, or even lower, as we continue to expect a new retest of the March lows. Now that the Bitcoin price had been capped by the area around the December 2019 lows, we believe this is a textbook breakout pullback setup and more selling could follow.
The less likely scenario, though, would be to see Bitcoin starting another impulsive leg higher. That won’t be impossible, but the price will need to break above this week’s high in order to generate a new higher high and shift the current bearish picture.
ETHUSD Kraken
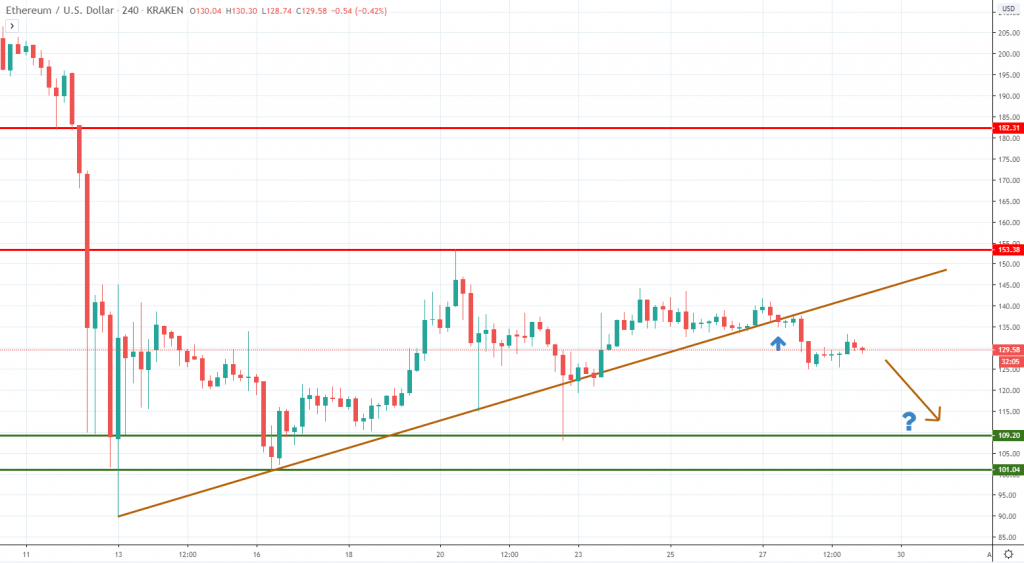
Same as Bitcoin, Ether is already showing signs of weakness after failing to remain above a short-term trend line. The price trades around $130 on the Kraken exchange and based on the current technical position, it seems poised for a continuation lower. We think the price will head towards the $109-$101 key support area and without a strong bullish reaction there, then the March lows will be next in our list.
We should also mention that the price could get choppy now that we are during the weekend and retest the broken trend line before it starts again to move impulsively lower. Only a break above $153 will suggest this could be a bottoming formation and until then, we stick to the bearish outlook.
At the same time, traders should trade cautiously in the next few days, since the price could swing in either direction, as the market sentiment continues to fluctuate wildly.
STRUSDT Poloniex
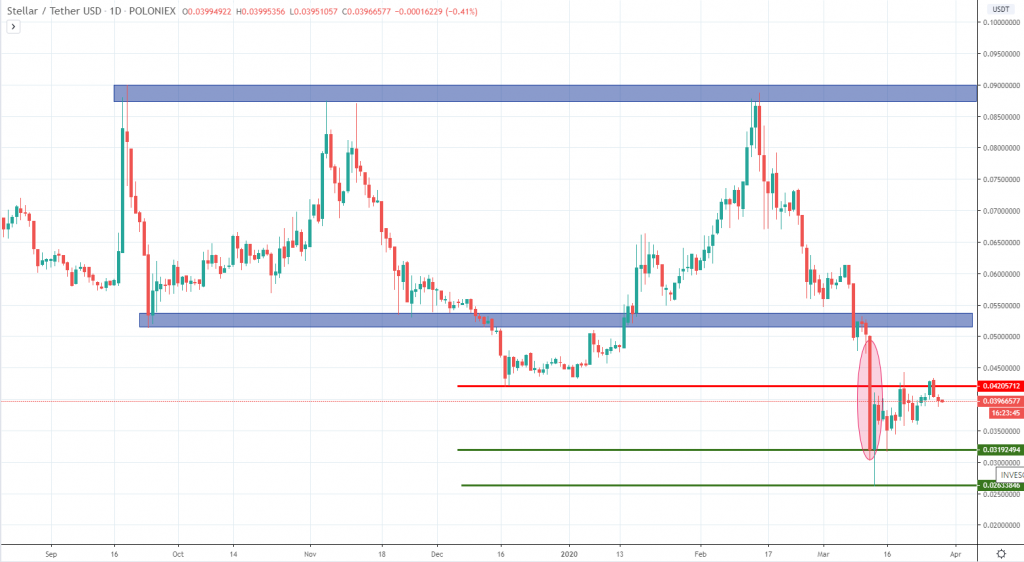
Stellar had broken below the big range we’ve mentioned several times in the past and as a result, the price had continued to make new lows. The March selloff had taken the price below the 4.2 cents low and with the latest correction, the price is currently hovering around it.
Sellers had been active so far, preventing a breakout above the level. As long as the price remains below 4.2 cents, we expect further selling towards 3.2 cents or 2.6 cents, which is also the March low.
Looking at the daily chart, the picture is heavily tilted towards the sell side, but we also see the largest selling candle, followed by a counter-trend reaction. That could be a sign of trend exhaustion and in the long run, it will be good for the Stellar price. We should wait and see whether the market will manage to break lower in April, or will it start to form a bottom.


There are no comments at the moment, do you want to add one?
Write a comment