
BTCUSD Coinbase
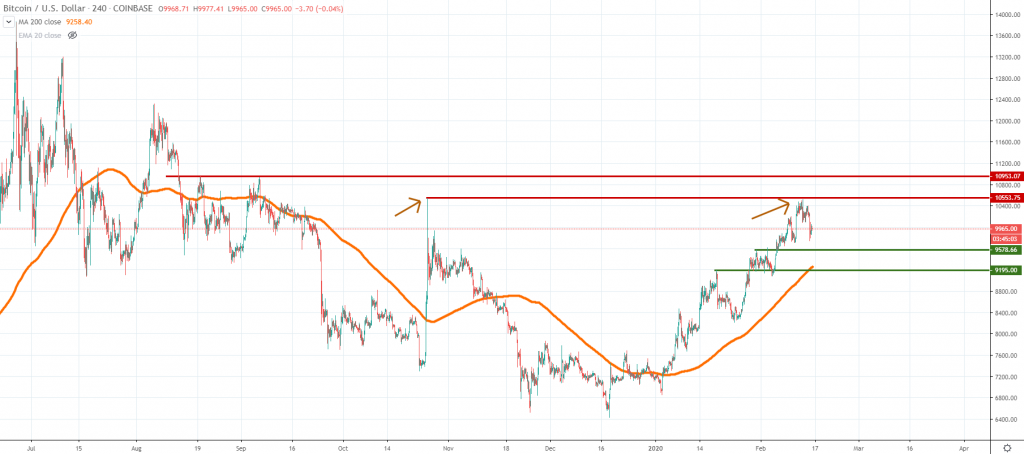
Bitcoin had managed to reach the October 2019 highs, as we’ve expected for a few weeks in a row, but it did not manage to break higher, communicating that a short-term setback could continue to unfold. During the past few days, the price action retraced from $10,500 towards the $10,000 at the time of writing, signaling strong profit taking or sellers entering impulsively.
It all depends on the impulsiveness of the move as we move forward. If selling will be contained, we suspect either $9,500 or $9,200 to act as support and potentially the beginning of a new leg higher. It’s been a little while since the price did not touch the 4h chart 200 moving average, meaning the price could retrace further on the downside.
On the upside, $10,500 remains a line in the sand and only a break above it could expose the $10,900-$11,000 resistance area. It’s possible buyers could have to wait for a little until the upside momentum will resume.
ETHUSD Kraken
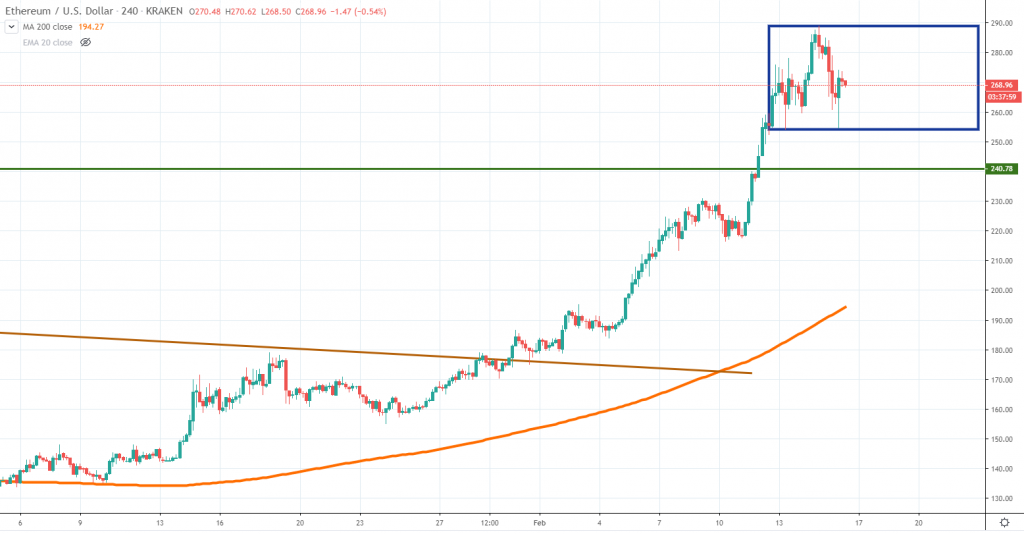
In line with Bitcoin’s performance, Ether had also retraced lower following a very impulsive move on the upside. The price action found resistance around $290 and during the past few days, it retraced towards the $255 area. Although the correction is the strongest since January, it does not seem to dampen the bullish picture so far.
As you can see on our chart, we’ve drawn a short-term range, confirmed by two points on the downside. If the $255 bottom will fail, then Ether could continue on its way down towards the $240 area, where buyers are expected to resume.
A breakout on the upside will suggest Ether has still room to go and the $320 key resistance area will be next on our list. Based on the current conditions, we believe Ether will be range-bound for at least a few days.
LTCUSD Coinbase
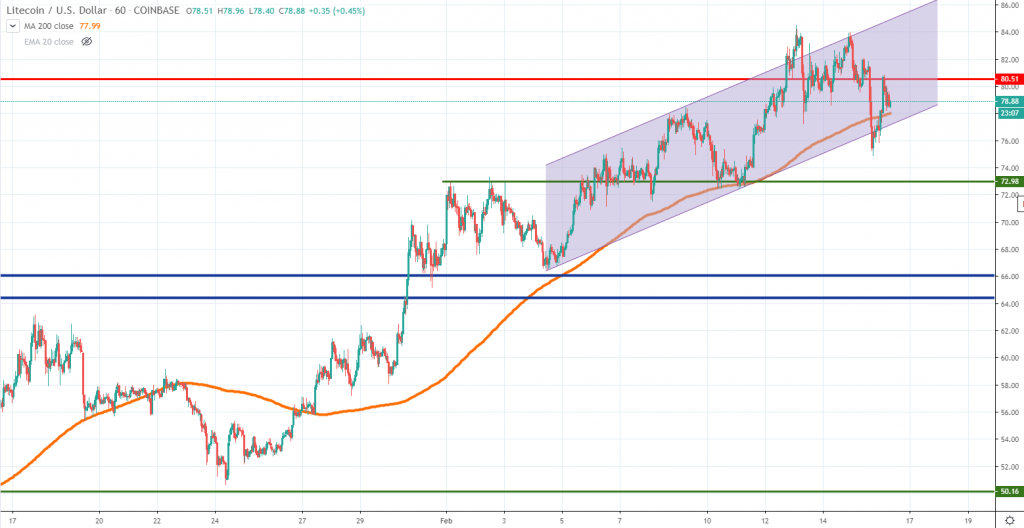
Since the beginning of February, Litecoin had been trading in a bullish channel, but lately, the selling pressure seems to have increased. However, the price action did not break below the structure, an occurrence that could prove to be a big hit for the buyers.
A breakout below the channel and below the 1h chart 200 moving average could signal further selling towards the $72 support area. Below that, the downside could further increase towards the key $65 area.
As long as the price will continue to trade inside the channel, we should expect more pressure on the $80 resistance area. If buyers will manage to overcome it, then the current 2020 highs and the $85 area should be eyed as a target. Our bias remains cautiously on the buy side, given that there is no break below the channel, but the selling had picked up steam.
Briefings about ICOs
Reflex s an ICO originating in Italy that will continue until February 20th. This is a blockchain-based project that wants to revolutionize the world of online social networks, promising a monetizing solution for everything people do on platforms like YouTube or Instagram.
Solarypto is an IEO starting on February 17th, providing an environmental-friendly solution to reducing the cost of cryptocurrency blockchain mining., using algorithms aimed at reducing energy consumption.


There are no comments at the moment, do you want to add one?
Write a comment