
BTCUSD Coinbase
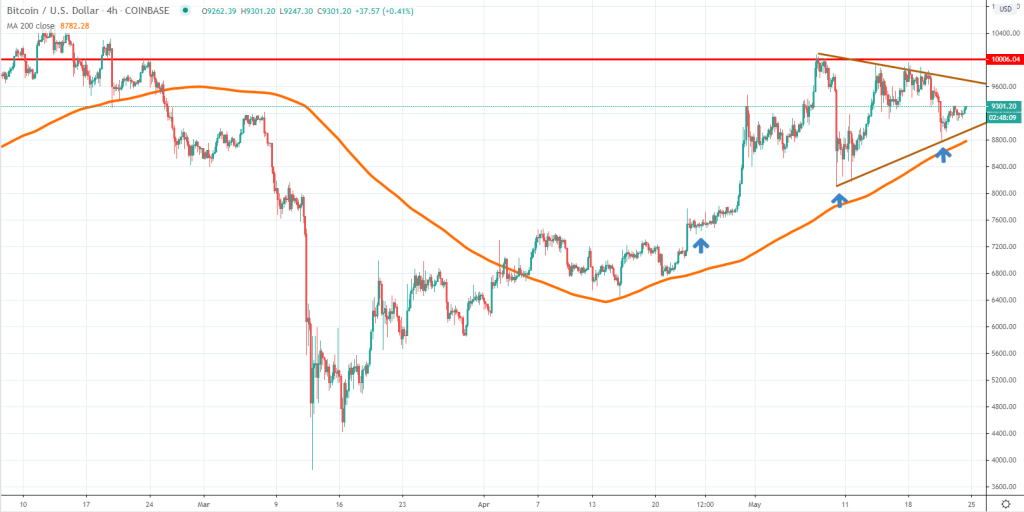
Bitcoin had not yet managed to retest the $10,000 area, as the price started to weaken just shy of the level. However, the price action does not suggest a change in the order flow occurred, but rather a corrective phase which is still favoring the bulls. Looking at our chart above, we can notice that Bitcoin is locked inside a small triangle pattern, heading towards the upper line as we write.
In the short-term, we expect Bitcoin to edge towards the $9,700 area, which is where the upper line of the triangle is located. A breakout above will make the retest of the $10,000 area imminent and could also unlock further upside towards $10,500 or $11,000.
If the triangle will break on the downside, beware of dip buyers around the 4h chart 200 moving average. Breaking below the MA will mean more downside could follow until the key $8,000 area. This doesn’t seem to be the most likely scenario, but the direction of the triangle breakout will also determine whether the price is headed.
ETHUSD Kraken
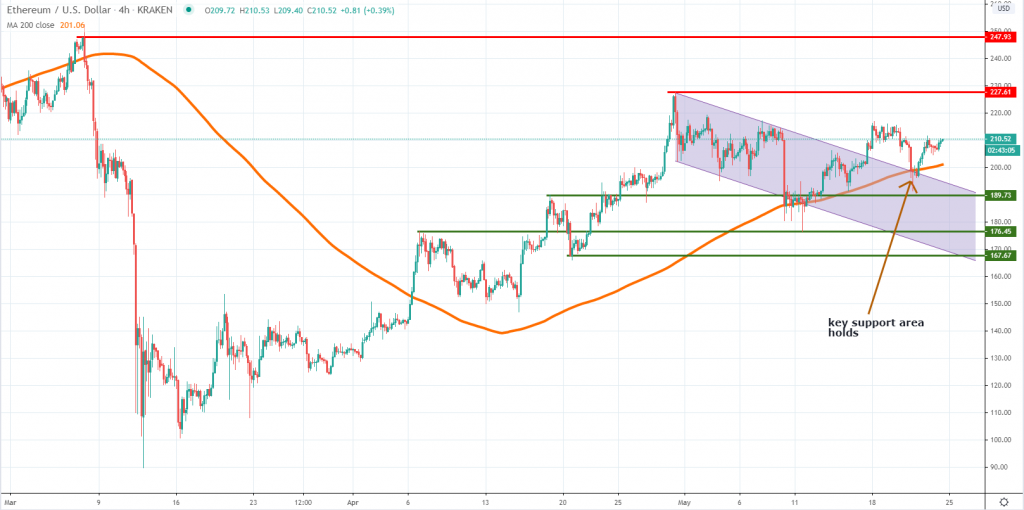
Ether had also been more active on the downside during the past week, but selling had been contained by the broker channel formation + the 4h chart 200 moving average. This confluence of indicators had generated enough buying power to prevent a drift lower and is keeping the longer-term parabolic structure in play. As long as the price will continue to trade above the MA we are bullish on Ether and expect it to retest the $227 resistance level.
Ultimately, all the losses encountered since March could be erased if the parabolic move will extend on the upside, which means the key $250 might be revisited during the next few weeks. Weakness will show up only if the price break impulsively below the last week low, an occurrence which will suggest sellers are in control over the order flow.
TRXUSD Bitfinex
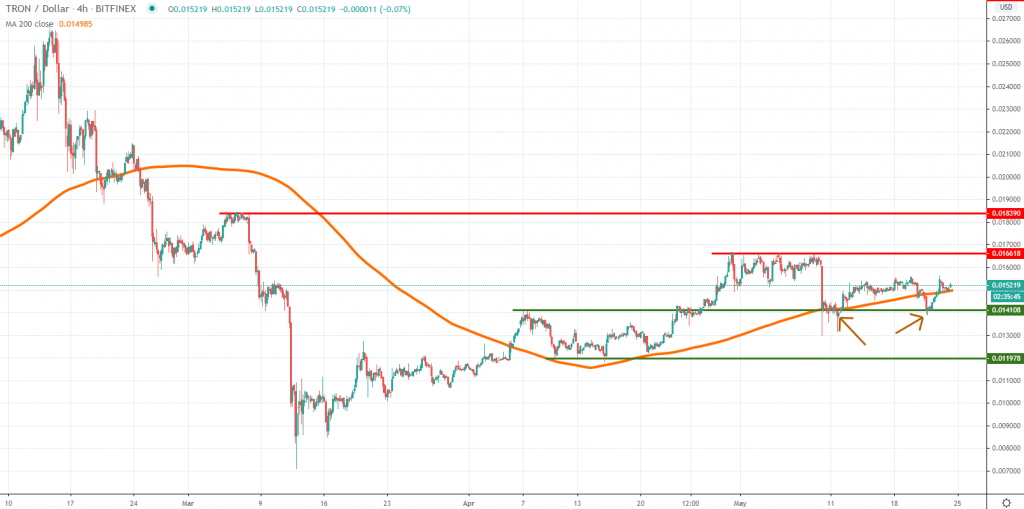
Tron had been relatively quiet since May 10th when a brief selloff occurred, but since then the price action made something interesting. The selling had been contained by the 1.4 cents key support area and now the price seems to be rotating on the upside again. As long as it will continue to trade above the highlighted green line, we think there’s more potential to retest the 1.6 cents level in phase 1 or 1.8 cents on a breakout above the former level.
Volatility is low, but it’s good to see buyers managing to keep what looks like a bullish parabolic structure intact. We remain bullish on Tron until a strong breakout below the May 10th low will occur. That will signal sellers are heavily in control, but for now, that had not been the case.
Also, weak selling reactions around the 4h chart 200 moving average will suggest sellers are not interested to dump TRX tokens. Lastly, the broad market performance will weigh on the price in the near term, which means the overall positive momentum is a benefit now.


There are no comments at the moment, do you want to add one?
Write a comment