BTCUSD Bitstamp
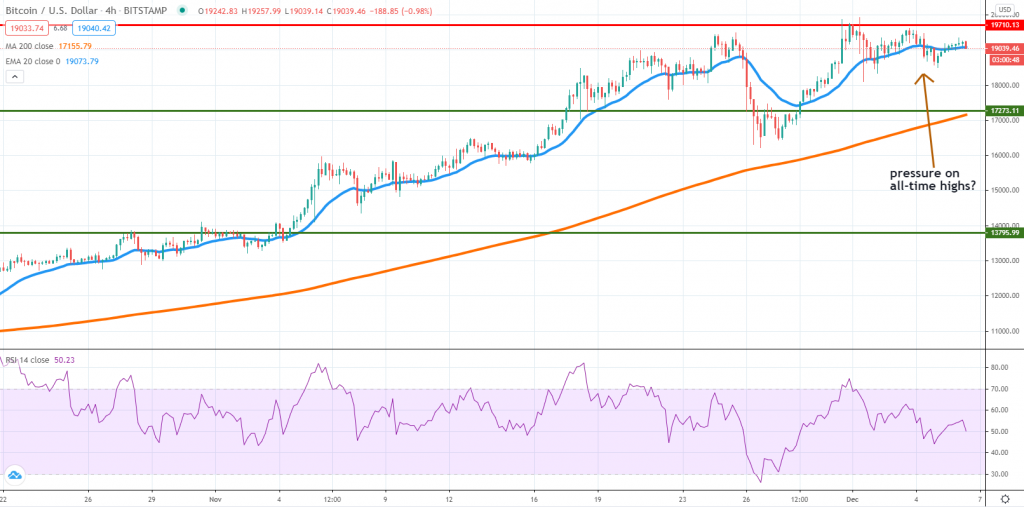
December 2020 started with a bang for Bitcoin, considering the price managed to briefly reach a new all-time high. However, as we’ve warned multiple times during the past several weeks, the 2017 high should be a strong resistance level and sellers truly emerged impulsively there.
In the short-term, that’s favorable for sellers, but on the other hand, we can’t see impulsive activity on the downside, which communicates this might be just another consolidation after a push higher. Buyers had been relatively active around the 4h chart 20 EMA and in case a breakout lower will occur, we suspect stronger support will emerge around $17,300, where the 200 SMA is also located.
On the upside, a breakout and daily close above the 2017 will suggest the bull run will continue. Be aware of false buy signals, considering Bitcoin is in overbought territory on higher time frames. We firmly believe that there could be more upside ahead, but choppy activity can’t be ruled out during the next week.
ETHUSD Kraken
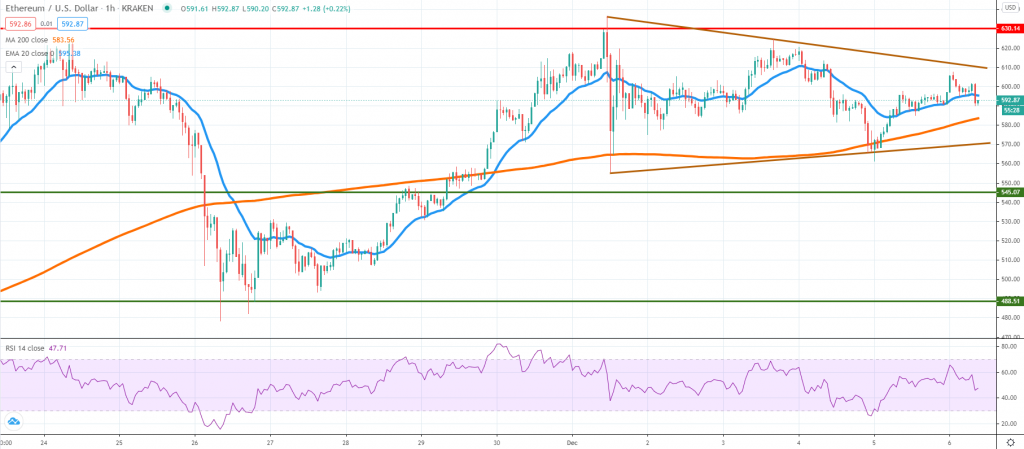
After touching the $630 resistance area, Ether sold off impulsively and since then, buyers were unable to retest it. On top of that, we can easily notice that a short-term triangle formation had been unfolding, with a breakout expected to occur during the next few days.
Compressing volatility could suggest another impulsive move might be on the horizon. If the break takes place on the upside, then we expect the $630 resistance to fail and the price to continue towards $650 or $700, other key psychological areas.
Breaking below the 1h chart 20 SMA below the triangle would be a short-term bearish signal, potentially pushing the price towards $545 or $490, where we suspect support might emerge. So far, selling looks rather contained, which means it may be possible that buyers will continue to hold the upper hand. Traders should wait, though, until the price action will have a more directional bias, to be sure they managed to position themselves on the right side.
XRPUSD Kraken
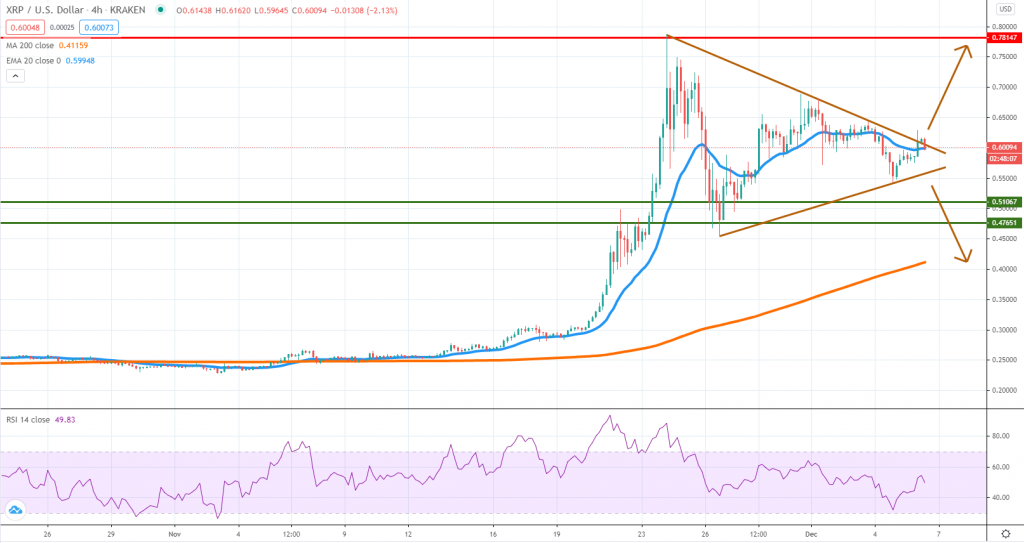
Once again, we’ve decided to include XRP in our weekly analysis, mainly because the token had been extremely active for weeks. More recently, volatility had been compressing and now it turns out the price trades locked inside a triangle formation.
The structure is almost filled, which means either side has the potential to gain an advantage during the next week. The pressure seems to be building on the upper side of the triangle and if a breakout will materialize, then it is very likely XRP will edge towards 78 cents once again.
In sellers will push the price below the triangle, they will need to overcome the 51 – 47 cents key support area to drive the market towards the 4h chart 200 SMA. November had been quite a month for XRP and it shouldn’t be a surprise if December will see it post smaller gains, even though seasonality is favorable this month.


There are no comments at the moment, do you want to add one?
Write a comment