
BTCUSD (Coinbase chart)
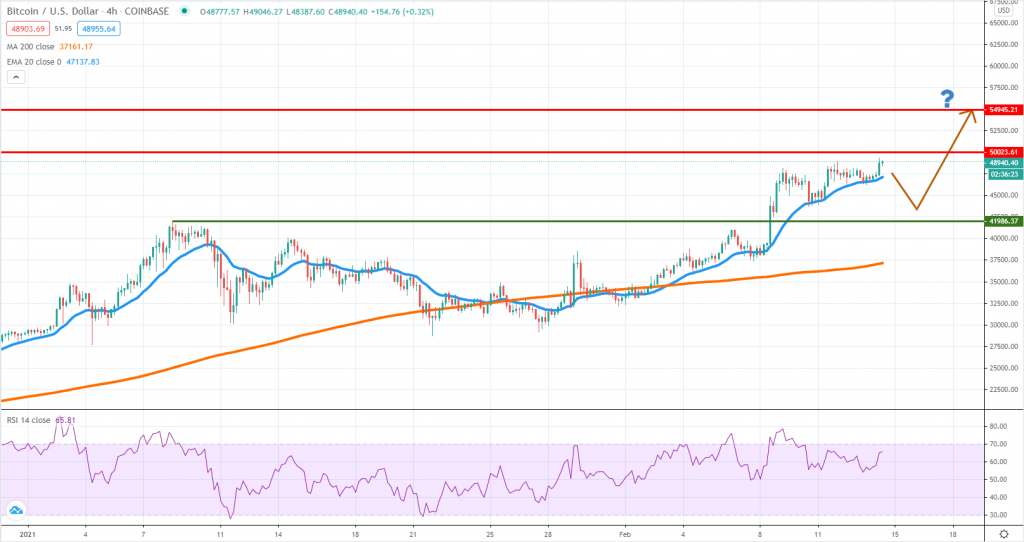
Bitcoin finally broke above the January 8th high last Monday and since then it never looked back. We can see on the chart how the price action is floating above the 4h chart 20 EMA, treating as a short-term support level. As long as the structure won’t change, we suspect there is still upside left to squeeze.
The first target is around $50,000 but based on past occurrences, the price generally breaks through psychological areas before starting to weaken. A continuation above that zone will open more room towards $55,000. We’re again in uncharted terrain and people need to monitor how the price action unfolds around these key psychological areas.
At the same time, we should not exclude a corrective move towards the $42,000 area. A past resistance, it is now a role reversal level where buyers could rejoin the trend. The prospects for Bitcoin had improved again and we should see sustained heavy selling before changing the bias towards the bearish side.
ETHUSD (Kraken chart)
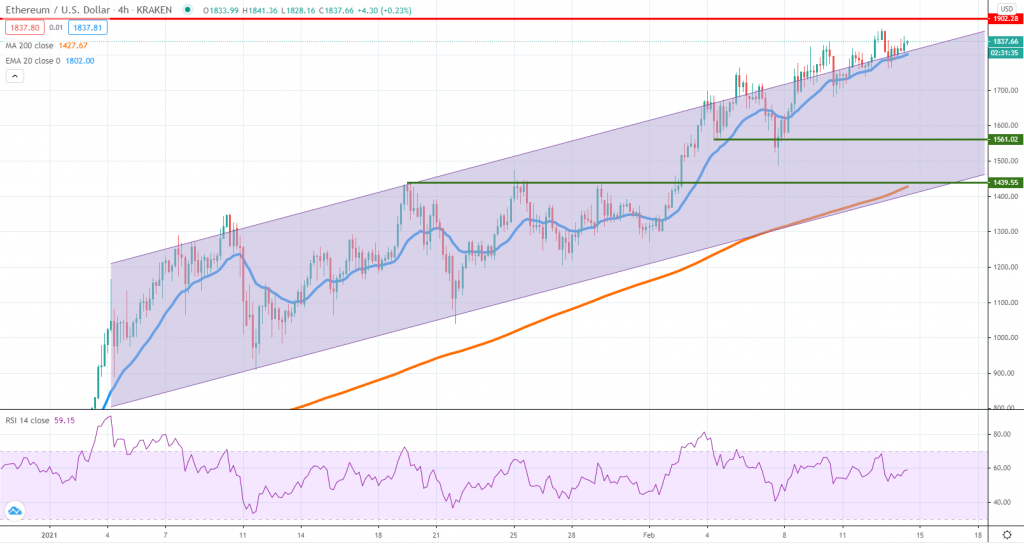
Ether did spend most of the week above our channel formation, but as it can be easily noticed, the momentum had been weaker. This is suggesting buyers are not so strong, leaving the market vulnerable for a correction. In the near term, resistance should be encountered around $1,900. Failure to break above it could be the main catalyzer for a stronger corrective move lower.
The bottom of the channel had not been revisited since the second half of January and we continue to believe that a drop will be a healthy development for the longer-term bullish trend. As a result, if weakness starts to unfold, look whether $1,560 or $1,450 will generate buying interest. Those are two of the areas where the selloff can be capped.
On the other hand, if the price will edge higher impulsively above the channel, that will be a sign of improved bullish momentum. In that case, Ether could reach or even surpass $2,000 before starting to weaken again.
XRPUSD (Bitfinex chart)
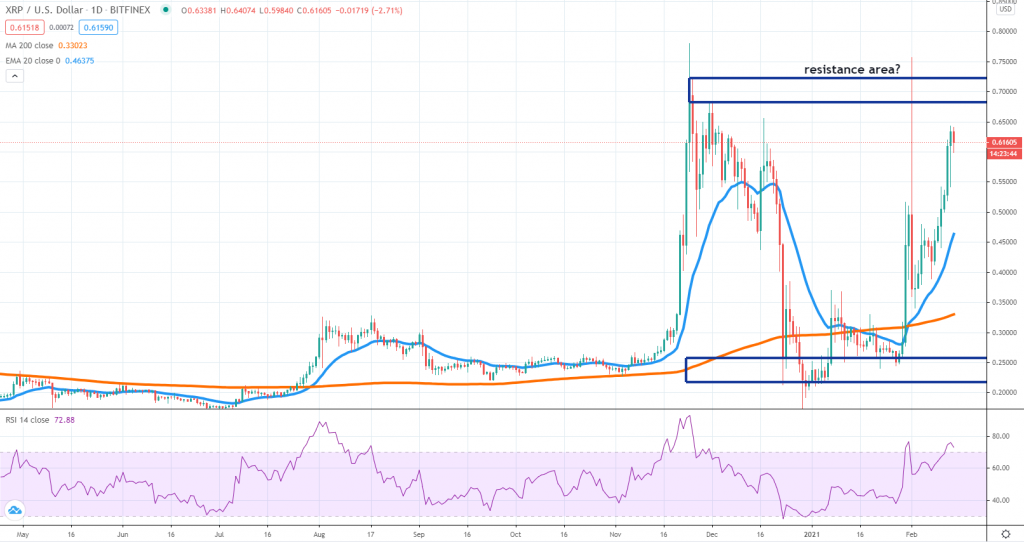
XRP continues to recover after the selloff generated by the SEC lawsuit and looks poised for a retest of the 70 cents key resistance area. As it can be seen from the chart, the price had been trading inside a very large range since November 2020 and as long as a breakout won’t occur, market participants can take advantage of both bullish and bearish legs.
Buyers are now squeezing the sellers out and the price had been moving up for 6 consecutive days. Regardless of short-term weakness, we suspect the upper area of the range could be under pressure in a matter of days. Should buyers break above the November 24th high, then it is very likely to see more follow-through buying.
On the other hand, failure to break on the upside will be an incentive for sellers to rejoin the market. The price could weaken towards 50 cents or the daily 20 EMA before finding support. The daily RSI is now trading in overbought territory and that raises the prospects for a correction before an impulsive continuation higher.


There are no comments at the moment, do you want to add one?
Write a comment