BTCUSD Coinbase
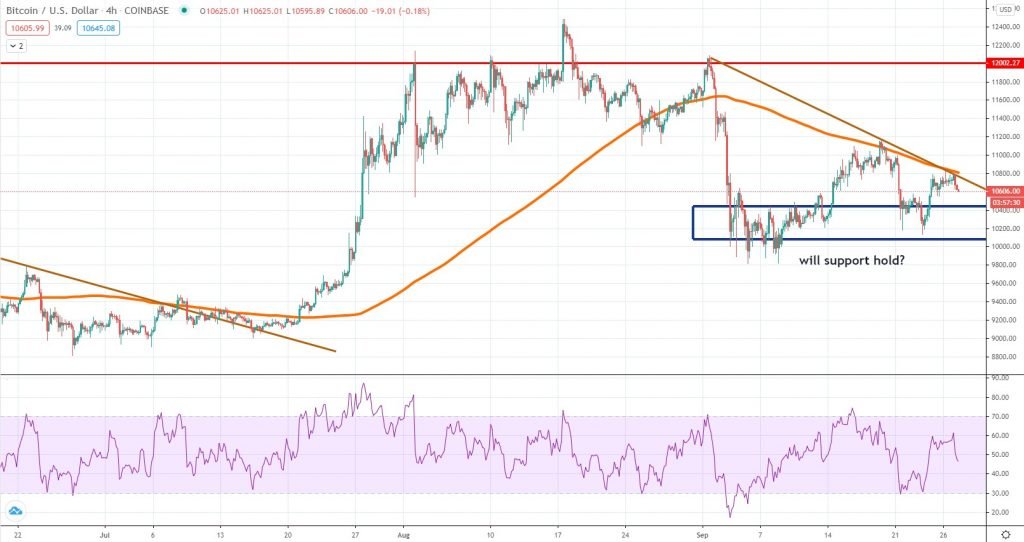
The price of Bitcoin continued to fluctuate between a key support area located around $10,400 – $10,100, and the 4h chart 200 MA, which is also reinforced by a short-term descending trend line. Although the price had managed to recover some losses during the past few days, it continues to be capped on the resistance zone, communicating the market is a point of indecision.
Traders should continue to play both sides of the structure, which means now it is very likely to see the weakness driving the price towards the $10,400 area. Breaking below the September 22nd low will be an important flashlight, considering that will mean more weakness emerged.
Also, breaking above the 200 MA would be an encouraging sign for buyers, showing an improvement in the broad risk sentiment. Until that happens, range trading is the name of the game, so watch how the broad financial markets will start the new week.
ETHUSD Kraken
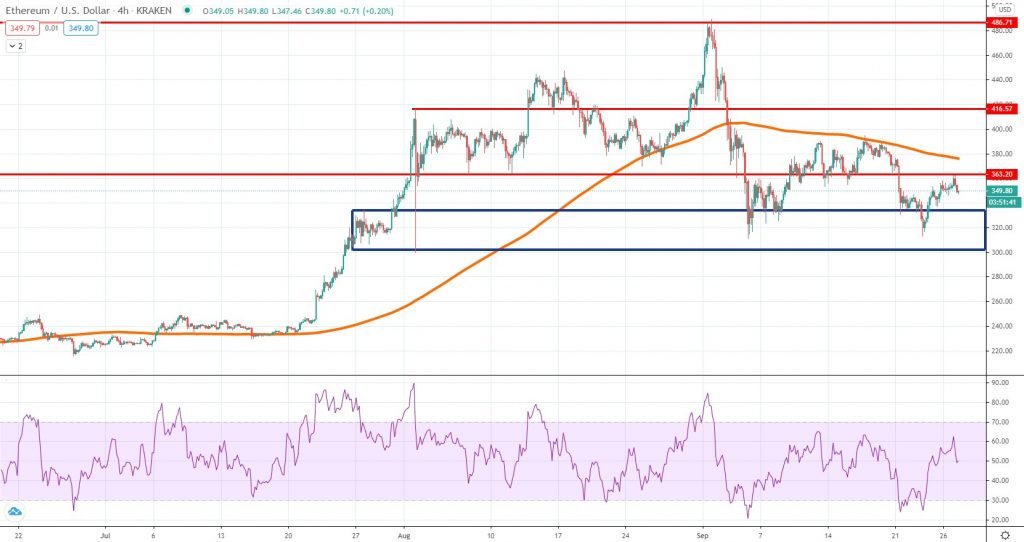
The first few days of the week were bearish for Ether, which slumped from $380 to sub $320 levels. However, the selloff was capped before breaking below the September 5th low and because of that, the rebound, that’s still in play, had whipped out more than 50% of the losses.
Still, following the impulsive selling move at the start of the month, ETH is in a difficult technical position, as buyers show they need more time before managing to rotate the price on the upside again. The $363 level acted as resistance today, so in the near-term traders should watch it.
On the downside, buyers should become active once the price reaches the highlighted support area. Judging by the RSI, the context is mixed, with either side able to gain control at the end of the month. It is important to note, though, that the RSI had not hit overbought conditions since September 1st, another sign of weaker bullish interest.
ADAUSD Binance
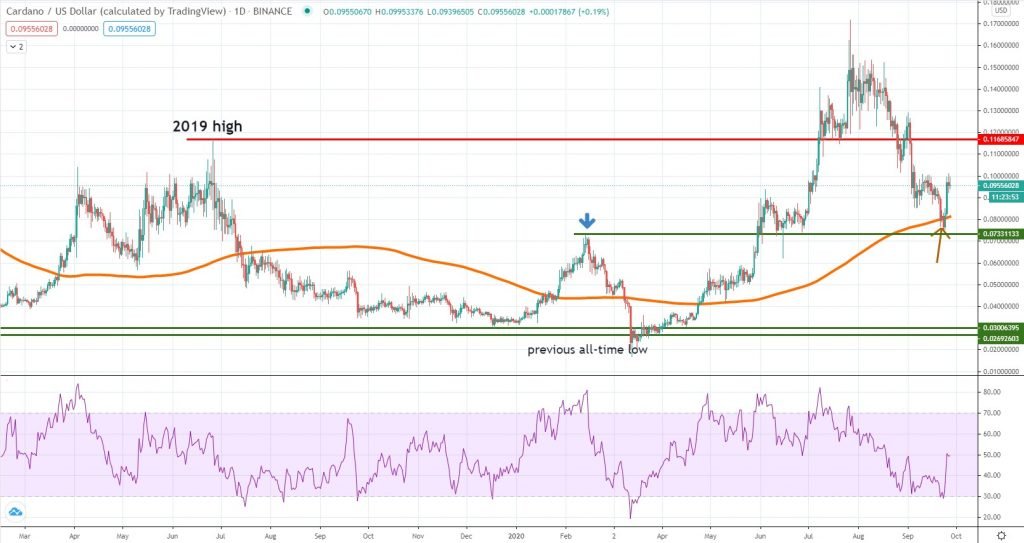
Cardano had been a major performer until August, but once weakness started to spread across the entire market, the price took an impulsive slump, dropping back below the 2019 high, located around 11. 6 cents. The bearish move erased more than 50% of Cardano’s value, not exactly the kind of development buyers were expecting.
Thankfully, the price stalled around the daily 200 MA + the 7.3 cents support, a critical area that generated enough buying to prevent further losses. In the mid-term, we could see the price edging higher, towards the 2019 high, but that’s where buyers will face the biggest challenge.
The good news is that the RSI had bounced from oversold conditions and is now edging higher, which is a short-term encouraging sign. In case of weakness resumes, we should look at the same support area to see if buyers are strong enough. A break below the current September lows will show bears are heavily in control.
Due to the impulsiveness of the selling move, we don’t expect a V-shaped recovery, which means sellers might try to drive ADA on the downside multiple times during the next few weeks. So far, the 200 daily MA is a key line in the sand, so as long as the price keeps trading above it, the longer-term view is still bullish.


There are no comments at the moment, do you want to add one?
Write a comment