BTCUSD (Coinbase price)
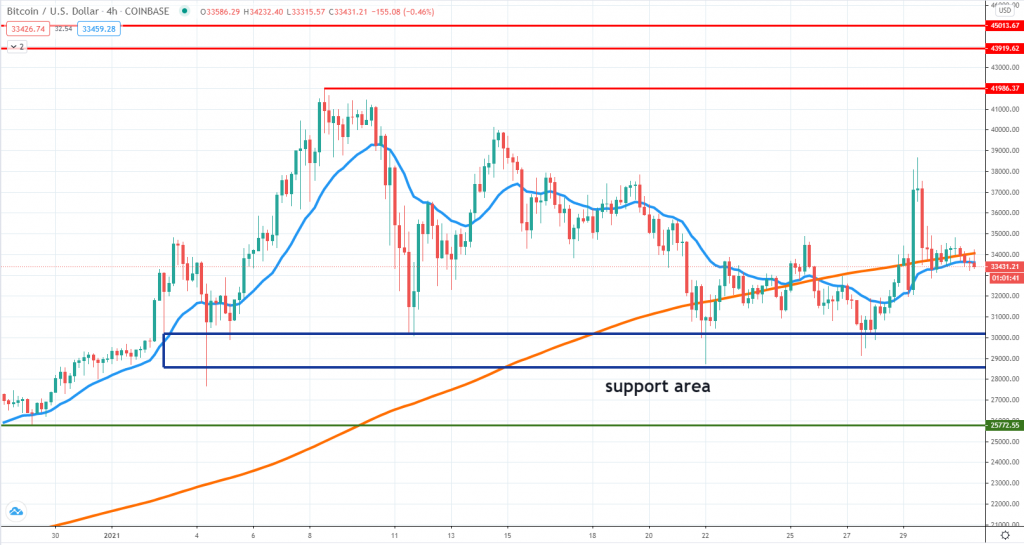
Bitcoin continues its choppy trading phase and there doesn’t seem to be a sustained interest from the buy-side, the kind of which might trigger the next leg up. What’s encouraging for bulls, though, is that the price action found support several times around $30k-$29k.
If that zone won’t be breached, it is possible to see buyers starting to rotate higher and threatened to break above $42k. If that would be the case, profit-taking could occur around $43k or $45k, but at that point, the continuation pattern will be confirmed.
We shouldn’t exclude the potential for a dip lower and a breakout below $29k would be an early signal. That could push Bitcoin towards $25k, where some short-term support can be spotted back in late December. Several days ago, Elon Musk updated his Twitter account, but the BTC buying that followed was short-lived. January ends net negative for Bitcoin and now expectations had been dialed back for February.
ETHUSD (Kraken price)
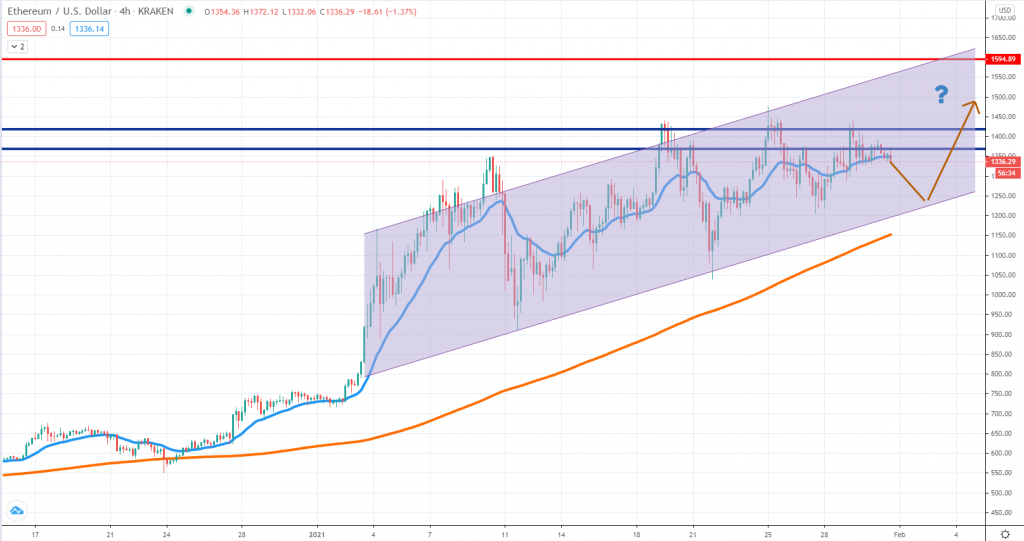
Even though it had consolidated the same as Bitcoin for the past week, Ether looks to be an outperformer since the losses are very limited and sellers squeezed towards the $1400 key resistance area. The 4h chart 20 EMA had acted as support for the past several days and only a break below it could expose the lower line of the channel, around $1,200.
The bullish structure is still in play, which means the buyers are in control over the order flow and can push the price higher in February. An early indication for stronger bullish momentum would be if the price manages to trade for a longer period above the highlighted resistance zone.
Such a development could signal a continuation higher, with $1,600 as the next key resistance level. On the other hand, buyers will need to keep the downside limited. The bottom of the channel and the 4h chart 200 SMA are where bulls can return in full force. Activity is very limited at the time of writing, which is why we advise patience until prices will move more impulsively.
XRPUSD (Bitfinex price)
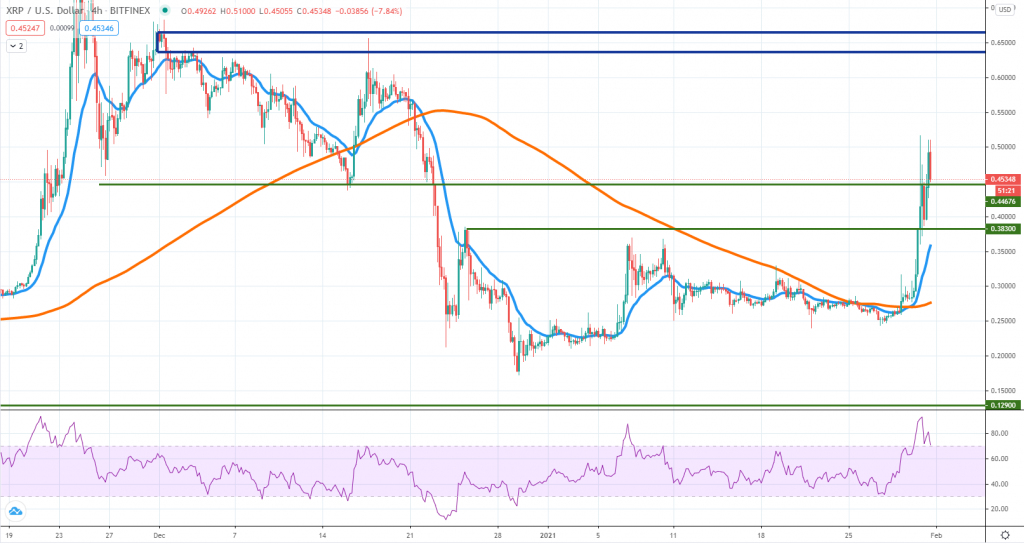
After the December dive, XRP is a net gainer in January and had managed to erase a substantial share of the losses. Trading around 46 cents, the token cleared a key resistance level around 38 cents and had been trending higher ever since. The bullish leg up is very strong, suggesting the order flow is biased towards the buy-side and that is raising hopes for the better in February.
If the price action structure won’t change, we suspect XRP will continue to head higher, potentially reaching 65 cents by the end of February. Some short-term resistance might be encountered there, but in case of a breakout, further upside will be unlocked.
Support is expected around 44 cents and 38 cents, followed by the 4h chart 20 EMA. Sellers are squeezed out of the market and a better BTC performance could act as a tailwind for XRP during the next few days and weeks.


There are no comments at the moment, do you want to add one?
Write a comment