
BTCUSD Bitstamp
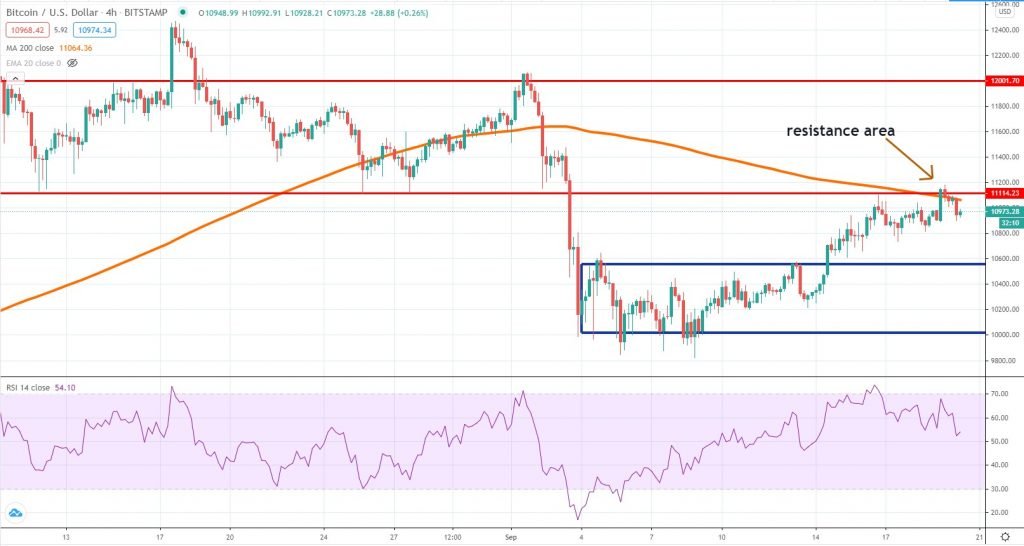
After breaking above the consolidation structure we’ve talked about a week ago, Bitcoin continued to recover but encountered resistance around $11,100, a resistance reinforced by the 4h chart 200 MA. Since the RSI was also easing after reaching overbought territory, the price action seems to have stalled for now.
Looking ahead, traders should wait to see whether the price will break above the resistance area. If that would be the case, we suspect Bitcoin could continue to recover until $12,000. That’s where the September selloff started and at least some profit-taking should occur.
On the other hand, continued selling will push Bitcoin back towards the upper line of the consolidation structure, where we expect support to emerge. Further weakness below it will expose the key $10,000 once again. It is good to see Bitcoin managed to recover despite weakness in stocks, which means the correlation had eased during the past weeks.
ETHUSD Kraken
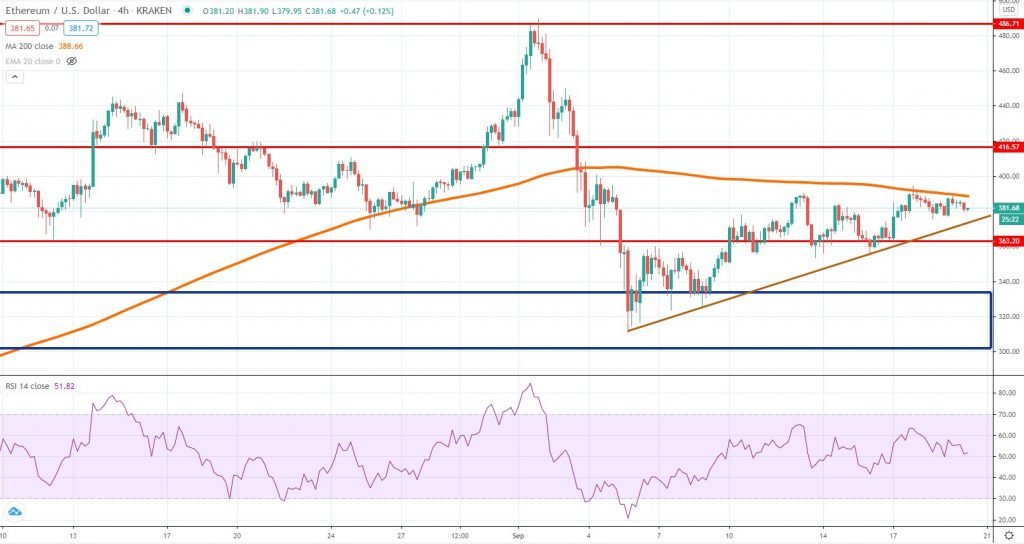
Even though Ether started to recover before Bitcoin, the past week had been poor in terms of bullish performance. The price also stumbled into the 4h chart 200 MA and since then it is consolidating in a narrow range. The short-term upside momentum is still intact, considering an ascending trend line had not yet been breached.
However, buyers taking a break before recovering less than 50% of the selloff is not a good sign and might suggest that the bottoming could take longer to form. Below the trend line, $363 is the first support, followed then by the key area around $300 – $330. That held during the selloff, confirming strong buying interest was located around it.
If the buyers will resume and break above the MA, then we should expect to see the recovery extending towards $416. The RSI had not yet reached the overbought territory, which means we could see some more gains in the near term. Risks to the downside persist and traders need to monitor how the market sentiment evolves into next week.
STRUSDT Poloniex
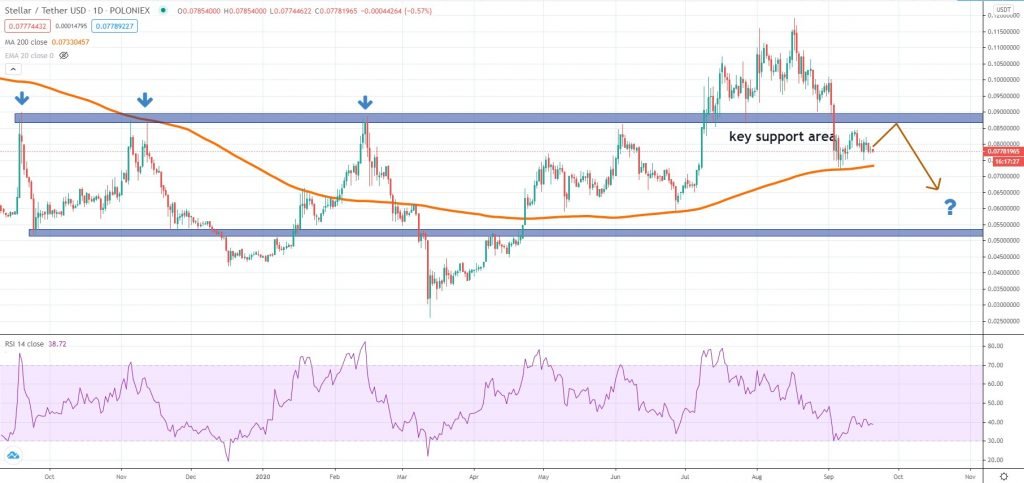
For months we’ve covered a large consolidation range in Stellar, which had been breached during this summer. However, despite being a major technical development, it did not spur additionally buying, but instead, it turned out to be a major opportunity to sell high.
The token price topped in mid- August and since then broke back inside the range, negating the previous breakout and now suggesting there could be more pain ahead. To confirm the break back inside the structure is legit, we should see the price retest the upper zone and sellers resuming impulsively there.
In case that happens, we should expect more downside in the next several weeks, as long as the daily 200 MA won’t hold as support. We should see a strong break above the structure, followed by sustained buying to have a confirmation the bullish trend is still intact, but for now, buyers are the ones under pressure. The size of the selling candles combined with a weak bullish reaction is not supportive.


There are no comments at the moment, do you want to add one?
Write a comment