
BTCUSD (Coinbase chart)
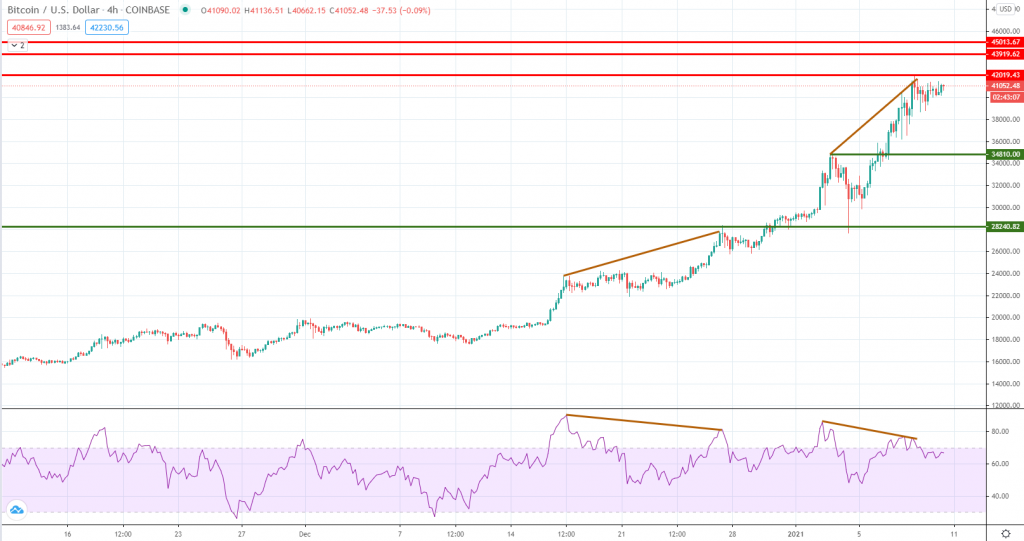
Bitcoin continues its impressive bull run and managed to reach $40,000. At the time of writing, the price is hovering near $41,000 after briefly touching $42,000. Even though there is still no sign of a short-term top, we can see massive divergence with the RSI, considering the price makes new higher highs while the oscillator makes lower highs. The only thing left for a corrective move confirmation is a selloff and break below short-term support.
If sellers will drive BTC below $39,000, then the attention will shift towards $35,000. Given the extreme overbought conditions, it should be no surprise if we see sudden dips, especially now that the USD buyers seem to be more active.
On the upside, a continuation above the current all-time high will expose $43k and $45k, two important psychological areas where some selling interest could emerge. Traders will need to trade with caution given volatility continues to be elevated.
ETHUSD (Kraken chart)
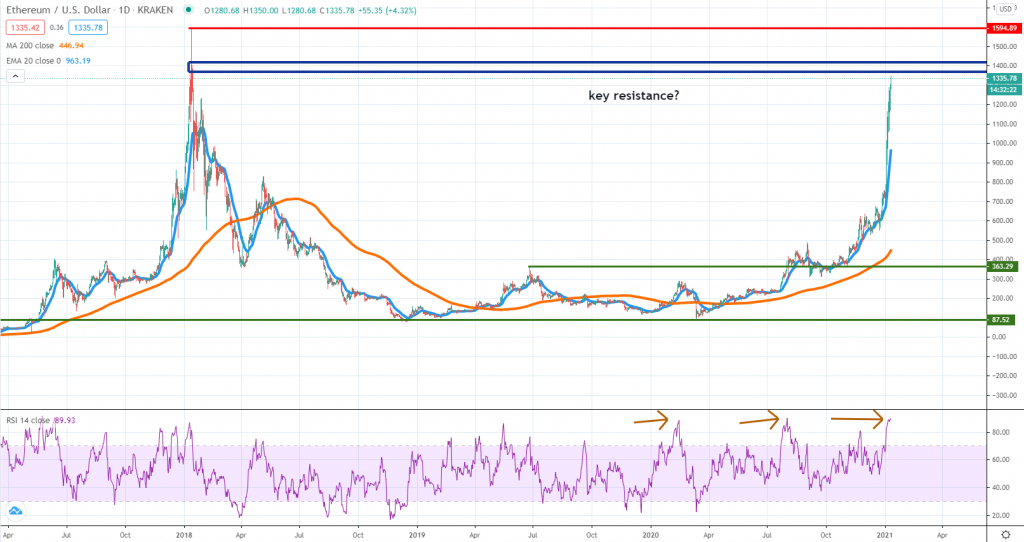
In line with Bitcoin’s exuberant performance, Ether continued to outperform and managed to reach the $1,300 area for the first time since January 2018. However, buyers are starting to show signs of exhaustion, especially given the extreme overbought conditions on the RSI.
This is the third time in a year when the RSI gets up to 90 and each of the prior two occasions was an indication predicting a larger corrective move in the market. That’s exactly what we expect to happen over the next few weeks and the key resistance area to watch right now is around $1,370 – $1,420.
Should sellers manage to defend it successfully, that will be an early indication for a deeper corrective move. We must consider the market moved un almost vertically starting with December 23rd and sooner or later, the momentum will start to fade. An overshoot and only then a correction shouldn’t be excluded, but from our point of view, a correction is highly speculative at this point.
BCHUSDT (Bittrex chart)
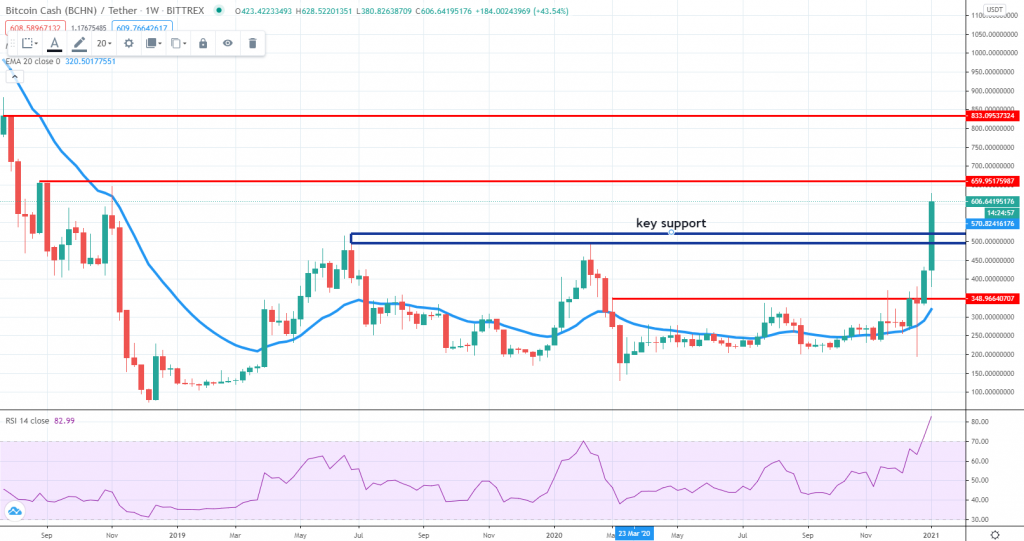
Bitcoin Cash surged more than 85% in value over the past two weeks and managed to break above a key area located around $500. Currently trading near $600, resistance could be encountered around $660, if buyers will push the price even further on the upside. However, same as other leading altcoins, BCH is extremely overbought and thus a corrective move should be expected.
In the longer run, breaking above $500 is a major technical development favorable for buyers. Still. That does not exclude the possibility of sharp pullbacks. Buyers that want to hold BCH for a long period should wait until the correction will materialize because that will provide an opportunity to buy at attractive valuations.
Support is expected around $500, and on the break below it, $450 should be another area to watch. Because BCH managed to break above February 2020 during the past week, that puts the token in the underperformers’ list, leaving it vulnerable in case selling will creep back into the market.


There are no comments at the moment, do you want to add one?
Write a comment