
BTCUSD (Coinbase)
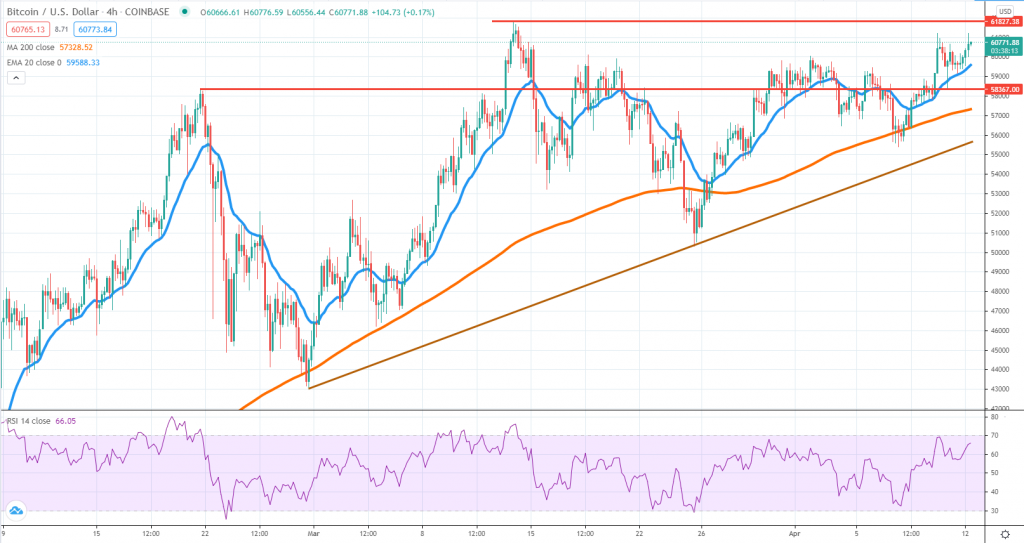
Bitcoin continues to press higher and the price is now hovering above $60,500 as buyers remain resilient. Since it is trading near the all-time high, our bias continues to be tilted towards the upside. If the resistance near $62,000 will fail to cap more buying, then the next likely target would be $65,000.
On the 4h chart, conditions are bullish, with the price trading above the 20 EMA and 200 SMA. These two are dynamic support levels and if they fail, more support should be encountered around $56,000.
This is a big week for all financial markets since inflation figures in the US will be released. The US dollar might be heavily influenced by the actual numbers and that means Bitcoin volatility could also spike.
If the news will generate dollar weakness, then BTC will very like break to a new all-time high. If risk aversion will lead to the dollar rising, some losses might be seen in BTC. Traders should be prepared for higher volatility starting with Tuesday.
ETHUSD (Kraken)
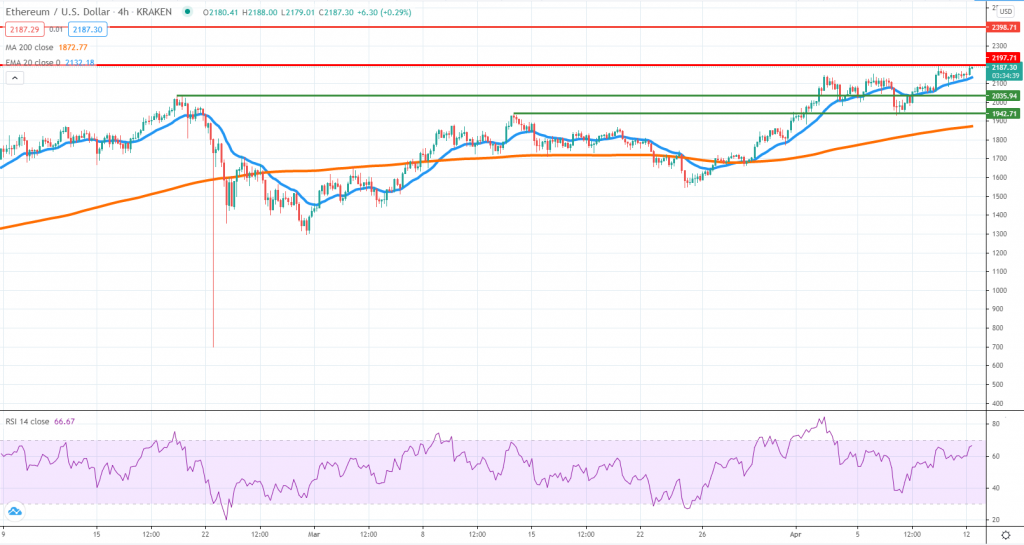
Ether continues to be in a much better position, as compared to Bitcoin, even though volatility is more subdued. The price trades above the 4h chart 20 EMA and keeps reaching new all-time highs, communicating buyers did not find any resistance so far.
At the time of writing, ETH is trading near $2,200 and if a new ATH will be reached, more upside will be unlocked, potentially towards $2,400. The RSI is not yet in overbought conditions, so there is still room for improvements on the upside.
Also, the price action structure is not yet suggesting sellers are regaining control. Same as with BTC, this week is all about the US dollar and risk sentiment, as critical data will be released. Until the actual figures will be public, it is difficult to predict where the price is headed over the next few days.
XRPUSD (Kraken)
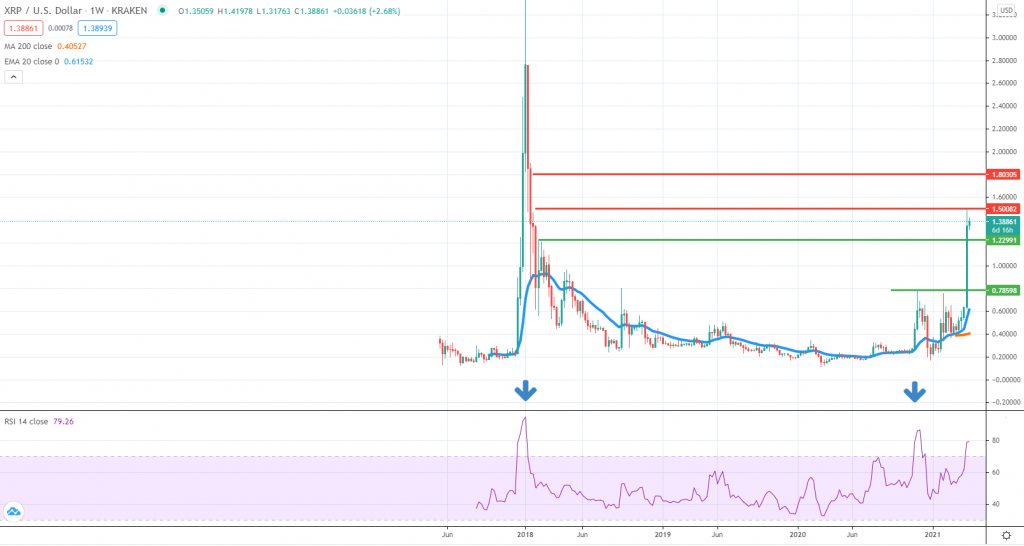
XRP was covered several times during the past few weeks and we’ve warned that once the price break above the November 2020 high, then massive upside can be unlocked. That is what happened last week and now the token price trades around $1.37 for the first time since January 2018.
The gains seen last week are staggering and shorting such a move would be extremely risky until more selling confirmation will be available. Resistance had been found around $1.50 and if the price break above it, there could be more upside ahead, towards $1.80 or $2.00.
As it can be seen on the weekly time frame, the RSI is in overbought conditions, but there are two prior occasions when the indicator reached much higher levels. On the downside, support is expected around $1.23, an area where a swing high occurred back in February 2018.
The good news for traders is that, unlike BTC or ETH, XRP is much more volatile, confirming market participants continue to rotate from extreme overbought conditions to subdued valuations. XRP still has upside room until the all-time high, which is why investors view it as an attractive store of value.


There are no comments at the moment, do you want to add one?
Write a comment