
BTCUSD (Coinbase)
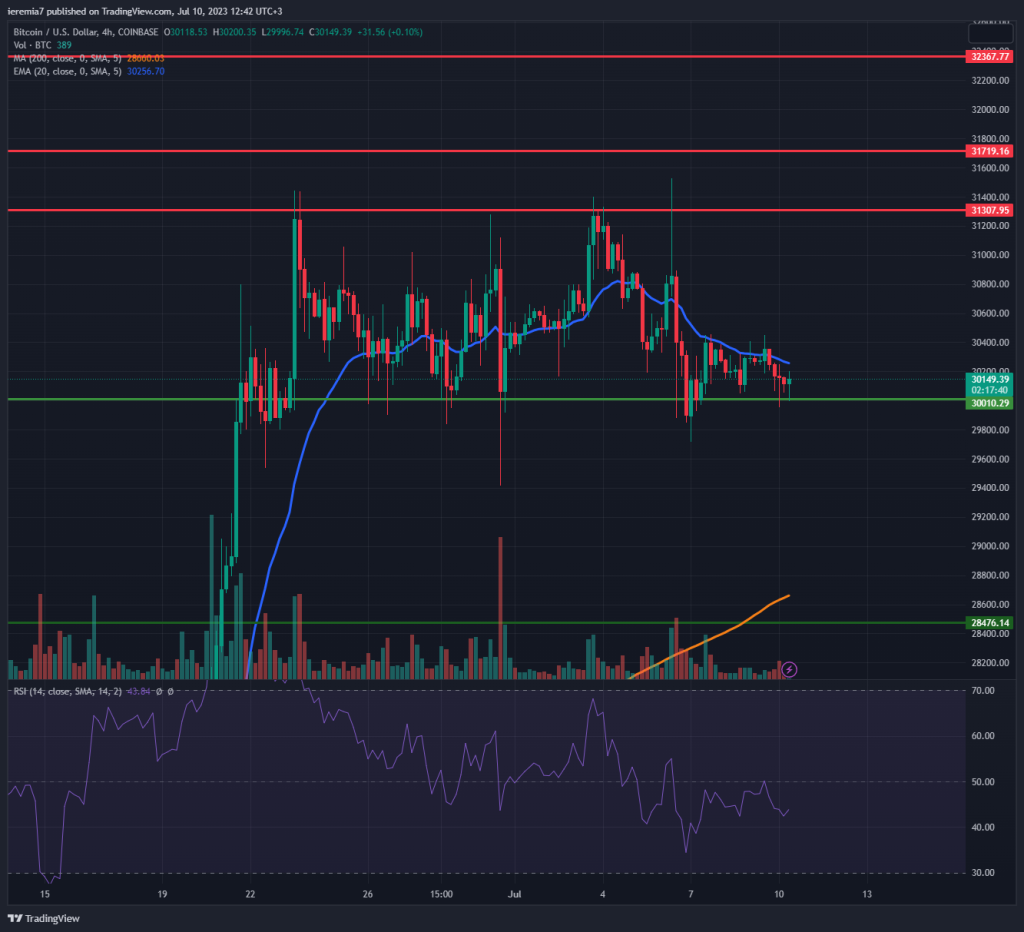
No major changes can be spotted in BTC last week and considering the market remained sideways we should analyze the 4h chart. It’s obvious that the price is inside a range between $31,300 and the key $30,000 area, considering the price has rejected both zones multiple times.
If the structure remains in play and given we are now trading close to $30,000, we should expect a bounce on the upside. The bull run failed to extend higher last week as sentiment across all major markets was dented by rising interest rates and tightening financial conditions. Combined with a rising US Dollar, these can act as a headwind for Bitcoin.
Regardless of these negative factors, the price is trading close to this year’s high, suggesting buyers remain in control. Breaking above $31,300 unlocks $31,700 and then $32,400 as the next key resistance levels traders should watch.
On the flip side, if the market breaks below $30,000 that will be a sign of short-term weakness. We expect BTC to retrace towards the 200 SMA and $28,500, which is a key support level.
ETHUSD (Kraken)
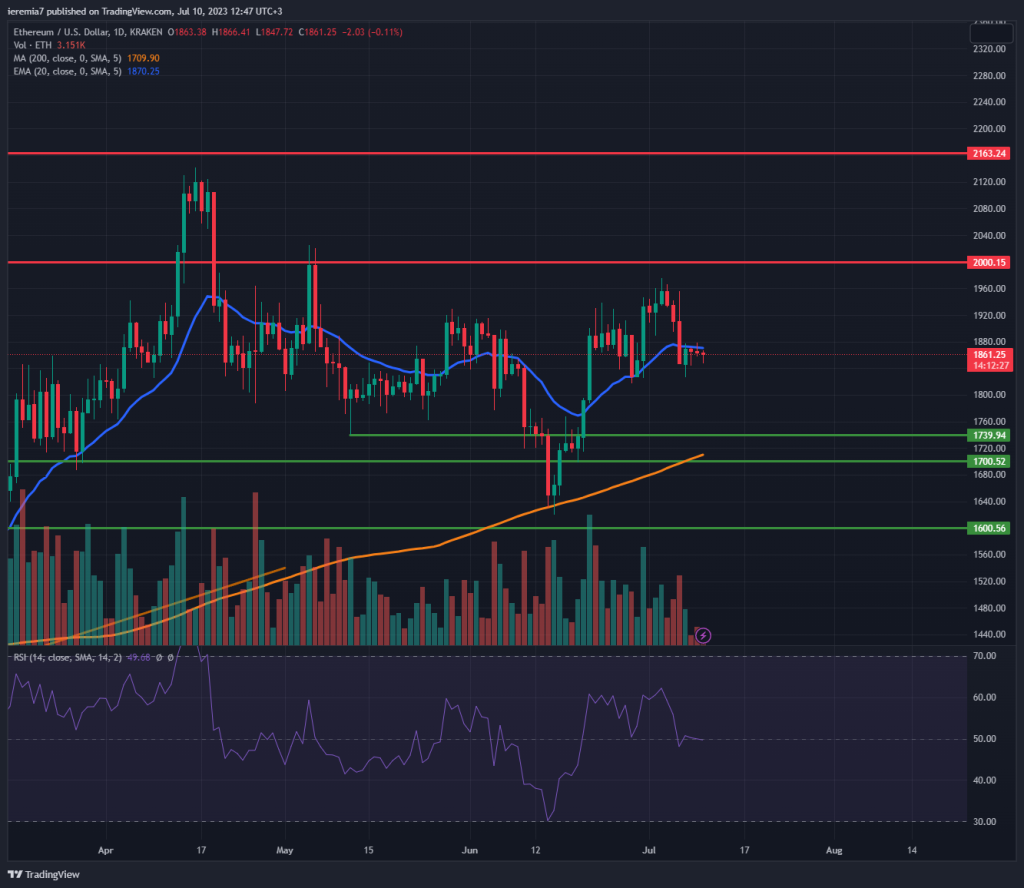
Ether volatility was higher last week compared to BTC, yet once again we see the market undecided on where to head next. Some subtle details, however, suggest the bullish momentum has not ended yet. That’s obvious because the price fails to break meaningfully below the daily 20 EMA. Also, the RSI is trading around 50, meaning the price can go in either direction from this point forward.
We give a slight advantage to bulls and there could be a possibility for a $2,000 retest. Above that, $2,170 emerges as another key resistance. Breaking below $1,800 will unlock further downside potential and $1,700 will become the next support to watch. The daily 200 SMA is also rising and approaching that zone, meaning that could be a stronger demand area. The last time the market touched the moving average, buyers stepped in impulsively.
SOLUSD (Coinbase)
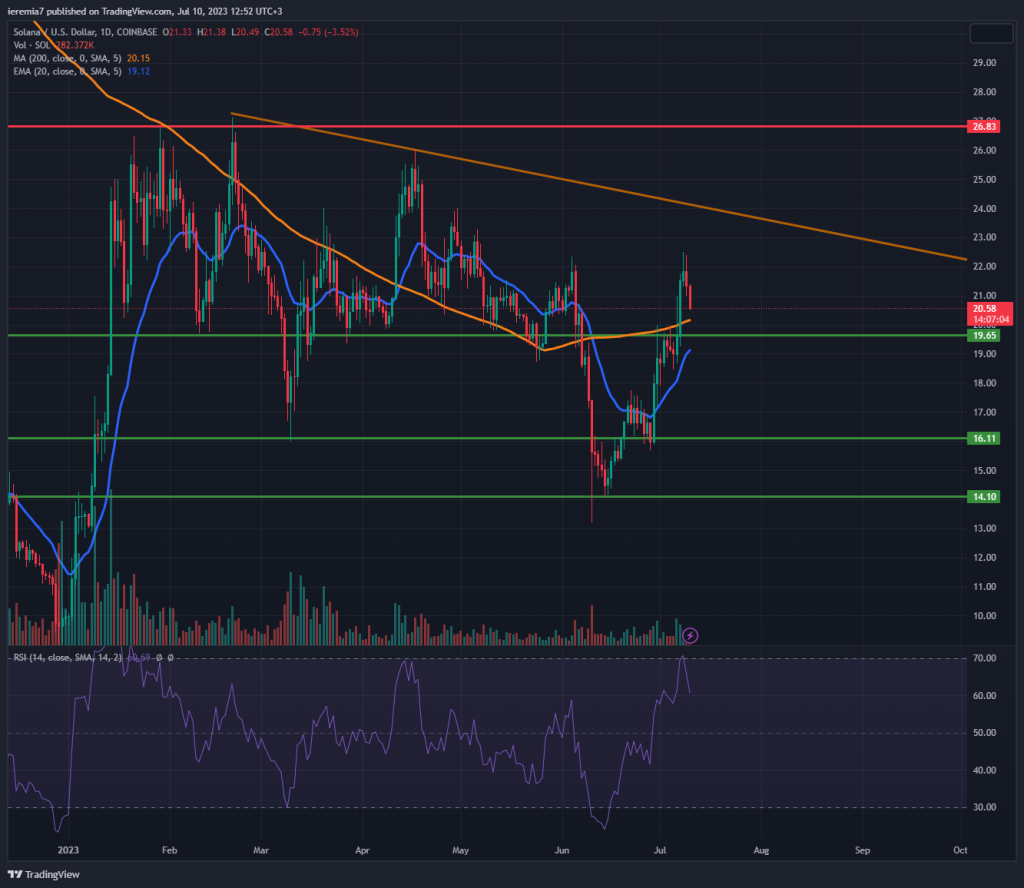
Solana rose over 6% last week, outperforming all its other major peers. When looking at the chart, conditions have improved for buyers, given SOL is now trading above the daily 200 SMA. The price seems to be headed towards a falling trend line we talked about a few weeks ago.
In case that happens, $23 is the first area of resistance to keep in mind. A break above would be a welcoming sign for buyers and will make $26 the next key area where sellers should emerge strongly.
We are not yet sure the coin is bottoming, given the strong push on the upside comes after a lower low. Because of that, buyers might want to wait for a deeper pullback. The areas of support are $20, $16 and $14. If the buying interest is strong, SOL shouldn’t retrace too much. At the same time, keeping above the 200 SMA would be critical to maintain confidence. The RSI touched overbought levels and then immediately pulled back.


There are no comments at the moment, do you want to add one?
Write a comment