
BTCUSD (Coinbase)
Source: TradingView
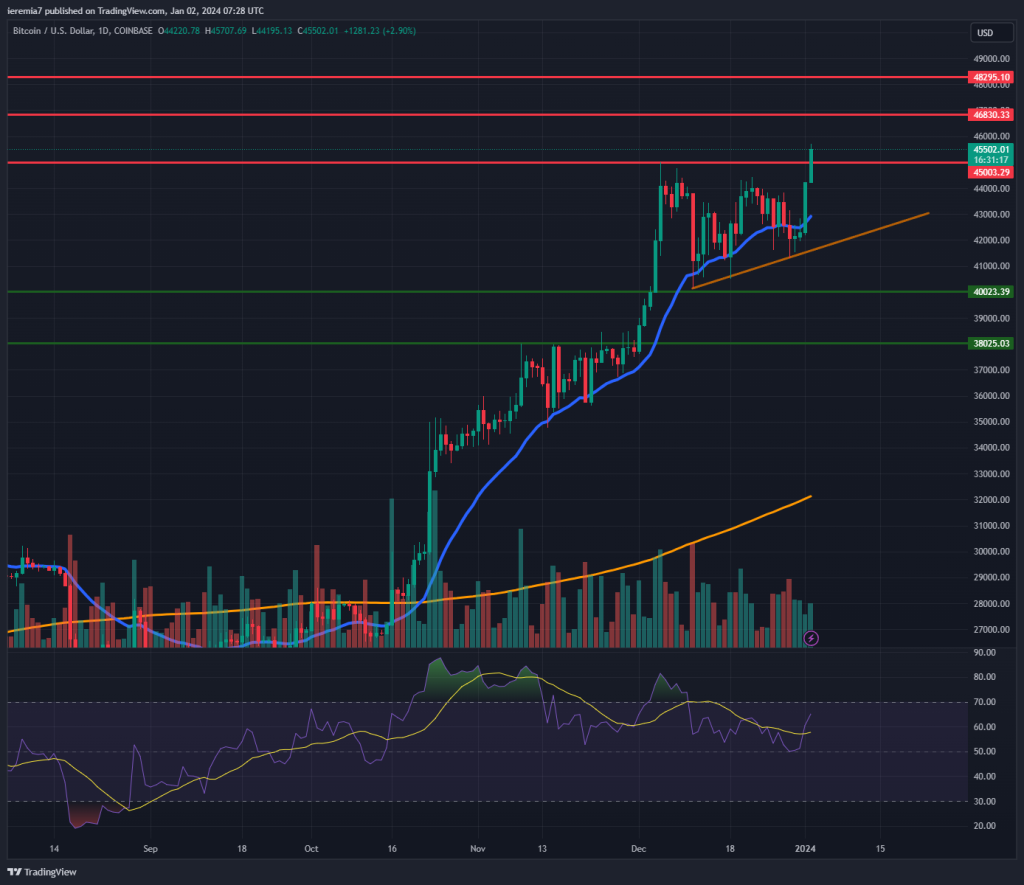
We’re back from the holidays and the script remains the same – Bitcoin continues to go up. Currently, the price is hovering above $45,000, a key level we’ve talked about in the past. It looks like the enthusiasm around a US-listed ETF drives bullish appetite, so this could shape up as a “buy-the-rumor sell-the-fact” scenario.
An official announcement from the SEC is expected sometime this month, so until then, shorting Bitcoin is not a good idea. With that being the case, we view $46,800 and $48,200 as key upside targets. You can easily see from the chart how the price action still treats the daily 20 EMA as a support zone. The bullish trend will remain intact as long as the relationship doesn’t change.
Our view will shift only on a break below the 20 EMA + the ascending trend line drawn on the chart. In that case, we think $40,000 will be revisited. Below that, $38,000 is another support traders might want to watch. Bear in mind that it’s still the beginning of the year and not all traders\investors are back at their desks.
ETHUSD (Kraken)
Source: TradingView
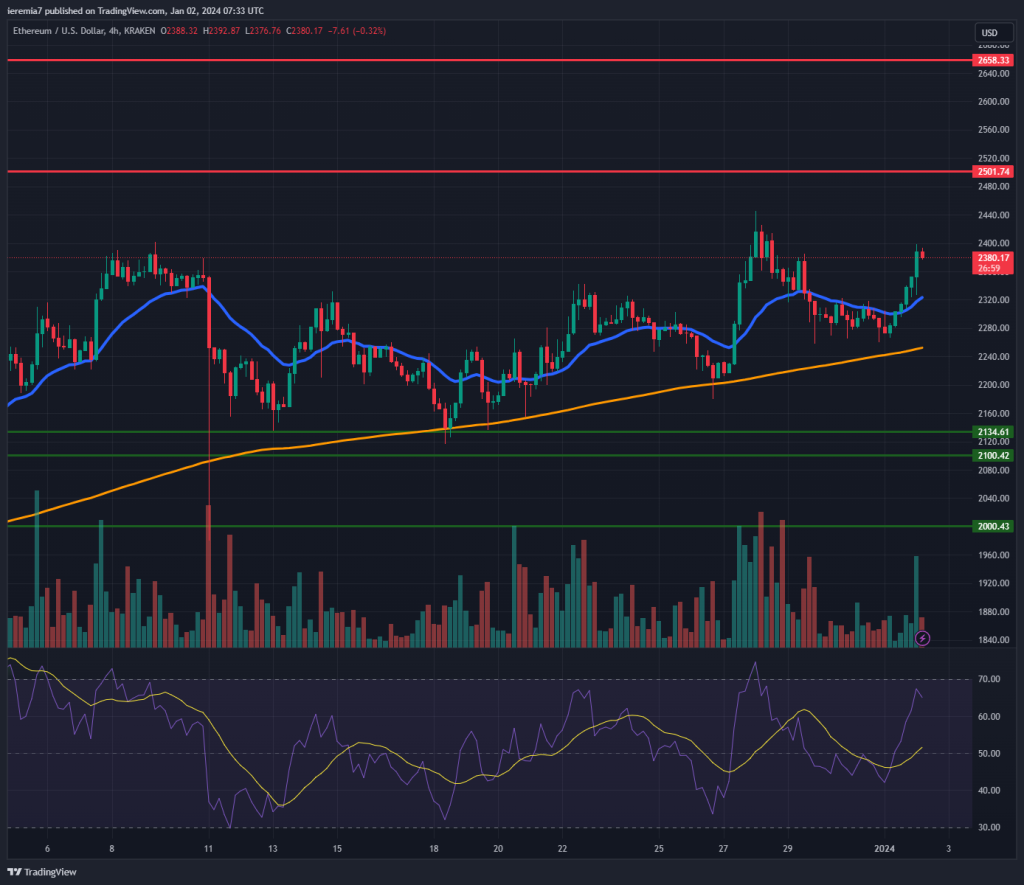
Ether is also moving up, but at a slower pace, when compared to Bitcoin. This is another crypto with the upside intact, yet differences in gains should be an important factor when you make a decision. At a technical level, we see deeper pullbacks and each time the 4h chart 200 SMA was touched, buyers resumed in force.
That’s the type of development you want to see to be sure that the buying appetite remains intact. As things stand right now, it seems like Ether could move up toward $2,500, or even $2,680. We advise you to watch those areas, as selling orders might be parked there.
Dip buying is favored until a break below the 200 SMA occurs. Naturally, traders will need to shift their attention to $2,130, $2,100 and $2,000 as likely support areas.
BNBUSD (Binance)
Source: TradingView
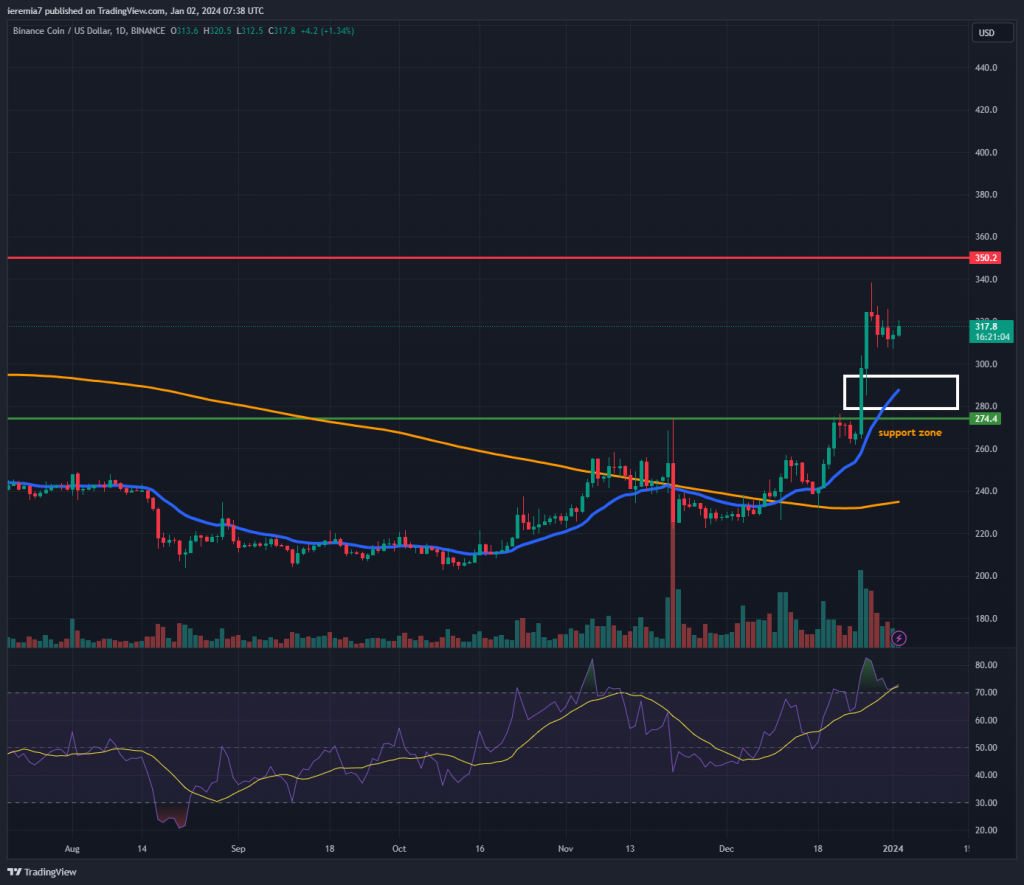
Binance Coin has been very active during the holidays, a period when the token surged higher nicely. We can see that with an +18% gain within 7 days, BNB is well positioned to continue further. After being clouded by scandals, it looks like investors have washed away all fears and are once again willing to buy.
Anyways, we focus on technicals, in particular, and for now, the upside looks like the most likely direction of price. BNB is trading well above the daily 20 EMA and we suspect it could edge up until the $350 key resistance area. When analyzing higher time frames like weekly or monthly, you can see how the price rejected heavily off that level in the past.
The area between $300 and $280 is highlighted as support on our chart, so only if the price breaks and holds below it, we should shift to a bearish stance. Even in that case, we need to see sustained selling driving the price below that daily 200 SMA, currently sitting close to $240. It will take some very bad news to turn the tide in that direction.


There are no comments at the moment, do you want to add one?
Write a comment