
BTCUSD (Coinbase)
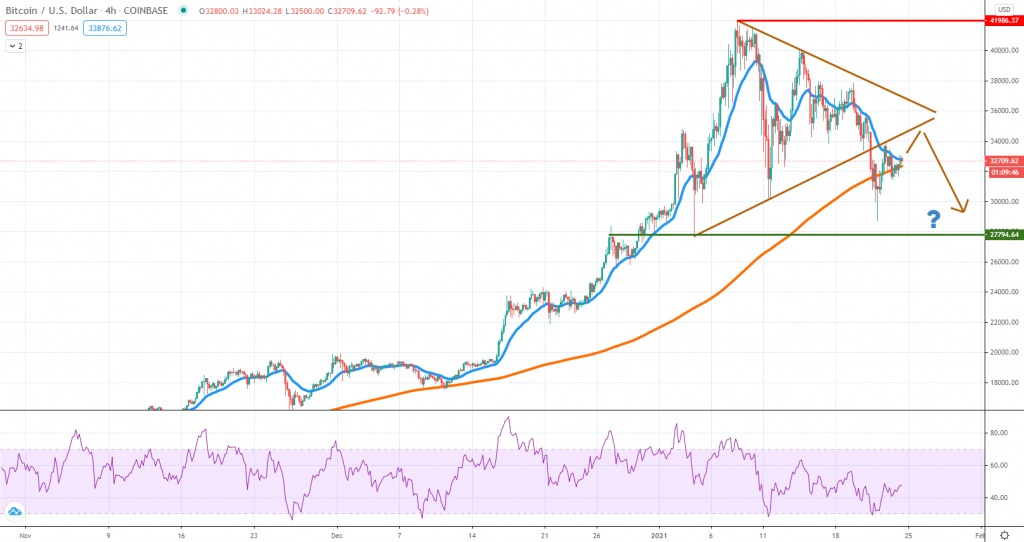
Bitcoin continued to underperform during the past week, as the US dollar consolidates higher and the global risk appetite is headed south. On top of the negative sentiment, the technical picture confirms buyers are not showing high interest to get involved.
The triangle formation we’ve talked about last week had been breached to the downside and that means the short-term momentum shifted in favor of sellers. Looking ahead, we should not exclude the price retesting the broken structure, but even that occurs, selling could resume impulsively around $35,000.
For now, the 4h chart 200 SMA prevents a slide continuation, but if the line will break lower, the next support is around $28,000, a level not reached since the beginning of January. Only a breakout above $38,000 could change for the better the current pessimistic picture and even in that case, the bull run continuation will only be confirmed if BTC breaks above the January 8th high around $42,000.
ETHUSD (Kraken)
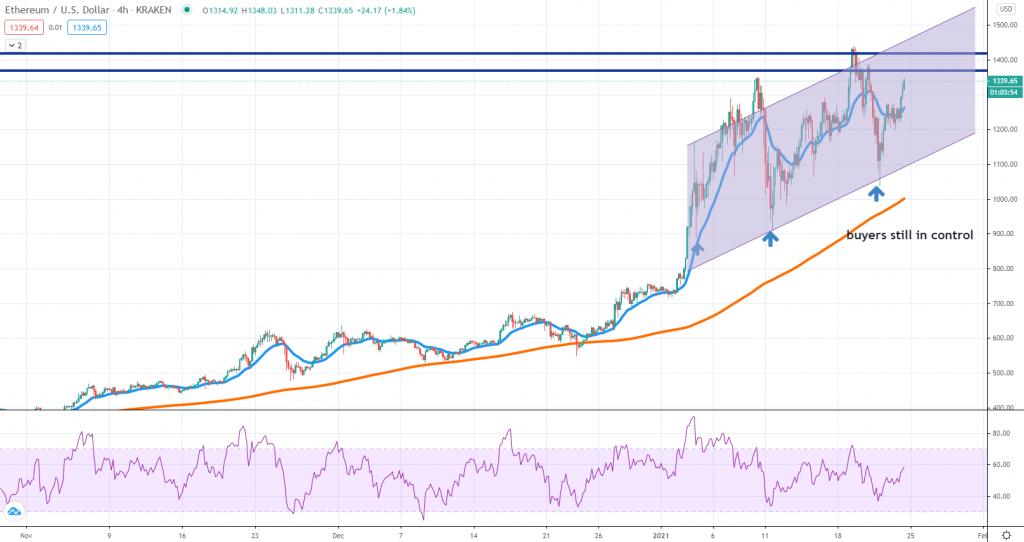
Ether seems to be outperforming Bitcoin, considering the price action structure looks different. Even though the presence of sellers is obvious, the bullish reactions are still impulsive, communicating the bull run can continue higher.
As we’ve anticipated for the past several weeks, the $1,400 proves to be a solid resistance, and only if buyers manage to break and close above it on a daily basis, should we expect more aggressive buying down the toad.
What’s for sure is that the trend had become more unstable, vulnerable to larger downside pullbacks. A major warning sign would be if the price starts to make lower lows and break below support levels. That had yet to occur, but it is one of the early signals to watch for those looking to sell ETH.
Buyers, on the other hand, can wait for a pullback towards the lower area of the channel highlighted on our chart. Buying activity had been seen three times already, so that’s the optimal place to get in the market.
DOTUSD (Kraken)
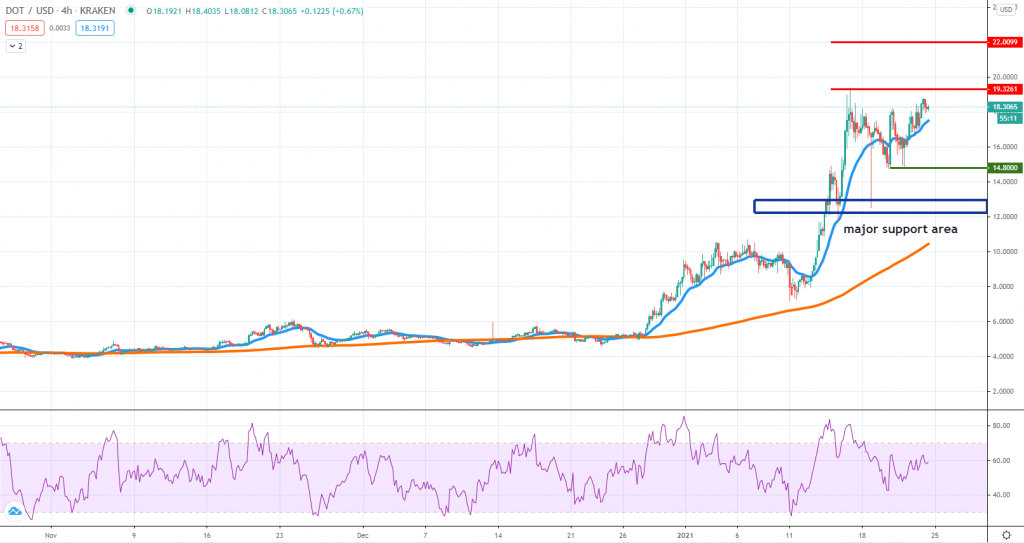
In an environment where large altcoins and Bitcoin are posting weak developments, the market’s attention shifted towards other names with high growth potential. Polkadot had seen a massive increase since the beginning of January and it is now the 4th largest cryptocurrency in the world by market cap.
Looking at the price action, the buyers are heavily in control, as sellers get squeezed towards the current all-time high around $19.3. A break above that zone will unlock further upside potential, with near-term targets located around $22 and $25.
On the downside, $14.8 and $12 are two critical areas to watch in case sellers regain control over the order. However, it looks like the buyers are keeping the price above the 4h chart 20 EMA and only if it will be treated as resistance, should we assume a change in the order flow occurred.
Despite the massive increase, the upside is still favored, given the RSI is not yet overbought. Until the price action will suggest otherwise, we think sticking with the upside is the better choice.


There are no comments at the moment, do you want to add one?
Write a comment