
BTCUSD (Coinbase)
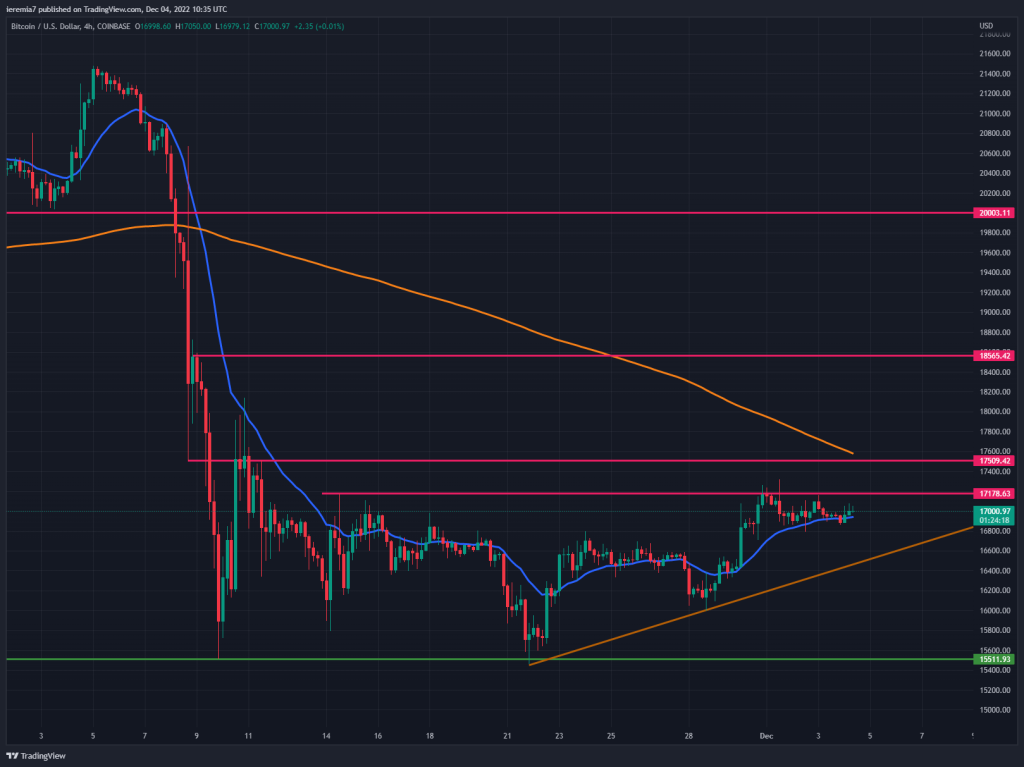
We are finally seeing the structure of the price action changing and Bitcoin respecting an ascending trend line. Even if traders should not get overly excited, this is an early indication the holiday season could bring some more gains for the token’s price.
Thus far, the $17,200 area acted as resistance and we think the same can happen around $17,500, where the 4h chart 200 SMA will also come into contact with the price. Breaking above both of them would be a bullish signal, opening more room toward $18,500. Only if the move up gathers steam, we might see $20,000 retested once again before 2022 ends, but be aware this scenario has a lower probability to occur right now.
Traders should not ignore the bearish plot and for that to kick in, BTC must break below the ascending trend line drawn on our chart above. If the price breaks and trades below it, then we could see $15,500 retested again. Either way, unless new major negative news from the industry emerges, it should be another calm week.
ETHUSD (Kraken)
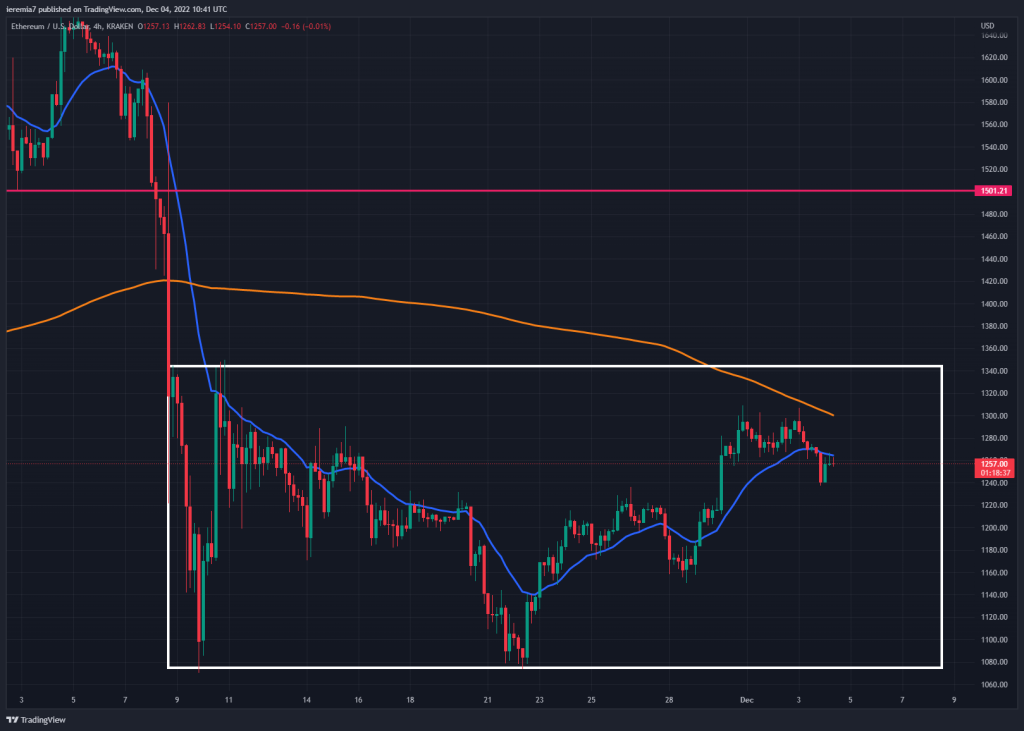
In the case of Ether, the price also managed to continue the rebound past week, yet some resistance can be found not too far from the current price. Looking at the bigger picture, ETH is locked inside a range between $1,340 and $1,050. On the upside, traders should watch for resistance near the 4h chart 200 SMA and then the upper line of the range.
As long as there won’t be a breakout higher, that will signal a balanced order flow and sellers can push the price lower. If a break does occur, our near-term target is $1,500. We need to see sustained gains across the industry for a rally to extend higher and for now, buyers look rather cautious.
The prior dip below the 20 EMA has been an opportunity to buy and maybe that scenario will repeat itself once again. If not, $1,160 and then the lower bound of the structure will come into play. Conditions are oversold on larger time frames, which is why we expect heavy buyers near $1,000.
MATICUSD (Binance)
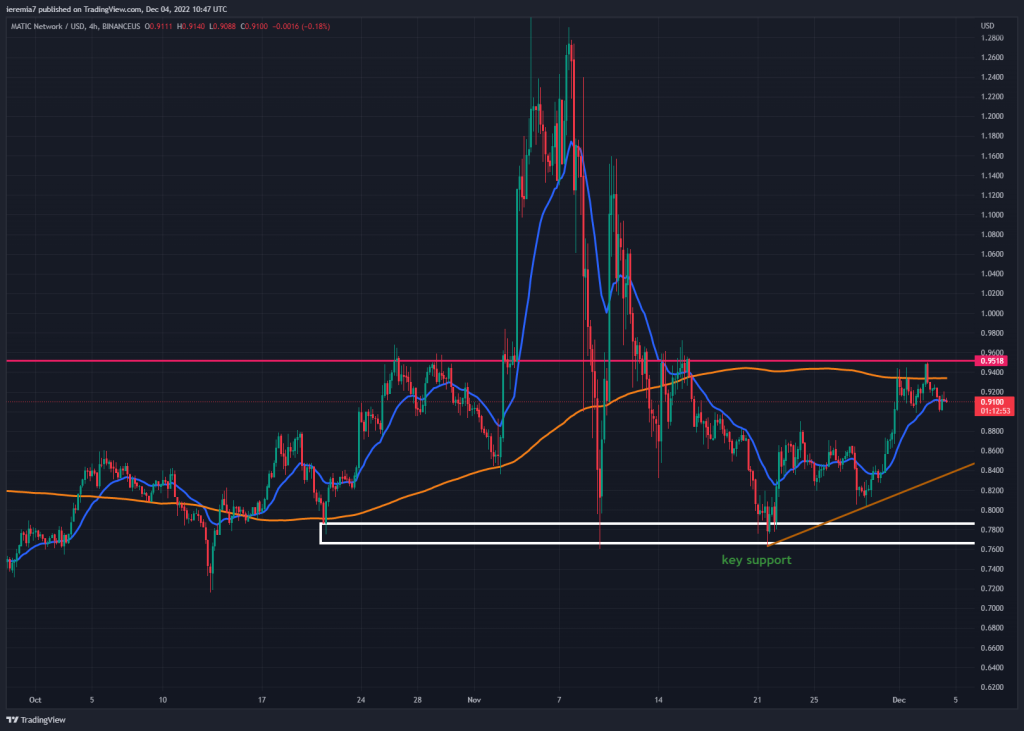
Another altcoin up almost 7% for the week is MATIC, which bottomed on November 22nd, after retesting the low seen at the beginning of the month. Since then, the price moved up, only to be capped by the 95 cents area and the 4h chart 200 SMA.
We can see multiple rejections off that zone in the past, meaning selling interest is preventing a breakout higher. At the same time, there is a short-term ascending trend line that should provide support near 84 cents, in case the price will dip further from the current point.
On a break above, MATIC can move towards $1.15, while only a breakout below the trend line will expose the 75 cents support area. If the bearish scenario turns out to be true, we could see further losses down the road.


There are no comments at the moment, do you want to add one?
Write a comment