
BTCUSD Coinbase
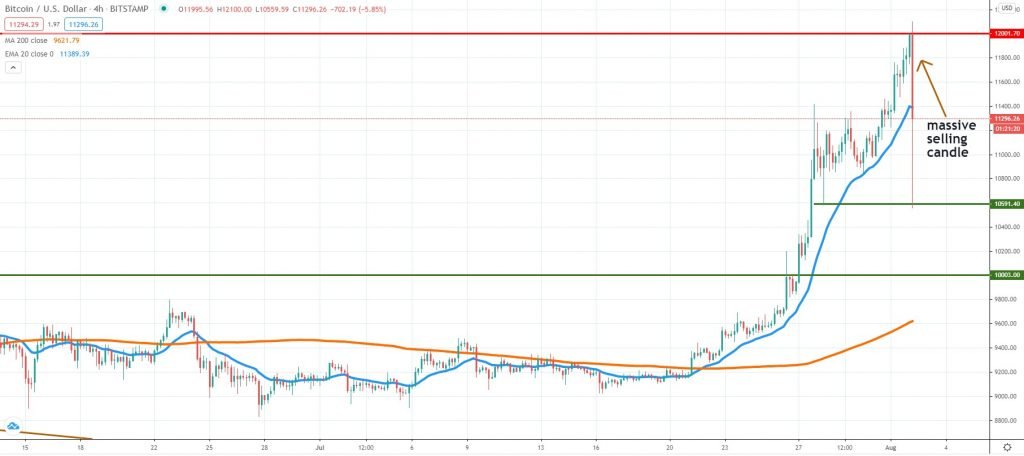
Bitcoin had quite an impressive run during the past week, breaking above the key $10,000 area and reaching the $12,000 mark for the first time since August 2019. The surge on the upside had been very impulsive, but as we are writing these lines, impulsive selling had been unfolding. It is Sunday and liquidity is very thin, but once the new week will kick start, market participants will be looking at the massive selling candle highlighted on the chart.
In terms of the key levels to watch, support had emerged around $10,600, so buyers are expected to be active around it. If that won’t hold, then the $10,000 area could be retested again. On the upside, sellers might start to rejoin around $11,500 and if they don’t then we should expect to see a new retest of the $12,000 area. The selling activity in the past two hours is worrying and it might signal a topping formation around the current week’s peak.
ETHUSD Kraken
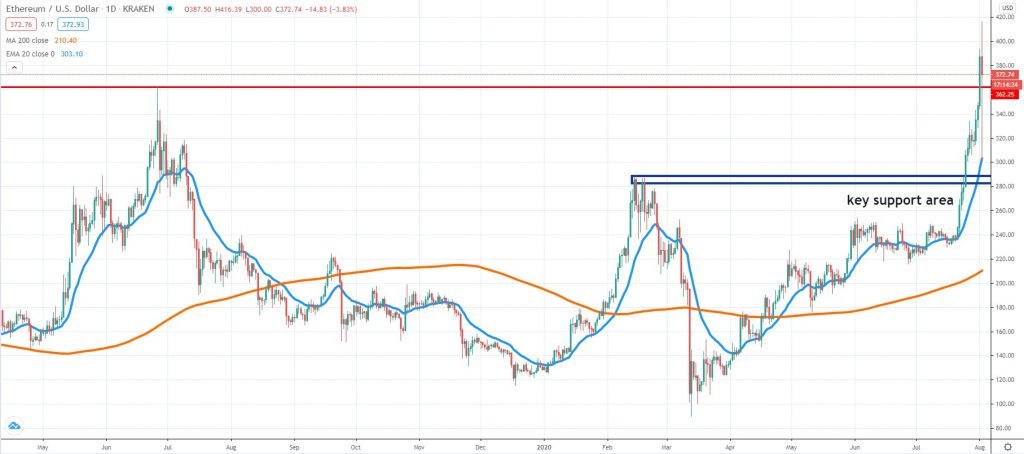
Ether had a week with massive gains, but the same as Bitcoin, it spiked lower impulsively during the past few hours. The impulsiveness of the selling is more severe in this case, as the token slumped from above $400 to as low as $300. This looks like a liquidity gap, mainly due to weekend conditions, but if that’s the case, then we could see some further selling in the days ahead.
One of the key areas to watch looking forward is around $375. The June 2019 high had been broken, but given choppy activity around it, we could see renewed selling pressure in case the buyers are unable to keep the price above it. Between $280-$290 lies a key support area, where we expect buying activity to resume.
Also, buying momentum could accelerate further if the price will break above $400 and stay there, without significant selling activity resuming. No matter how the current daily candle will close, it will be the highest since March 12th, the day when the market reversed the trend. Can it happen again this time? We need to see follow-through selling in the days ahead.
TRXUSD Bitfinex
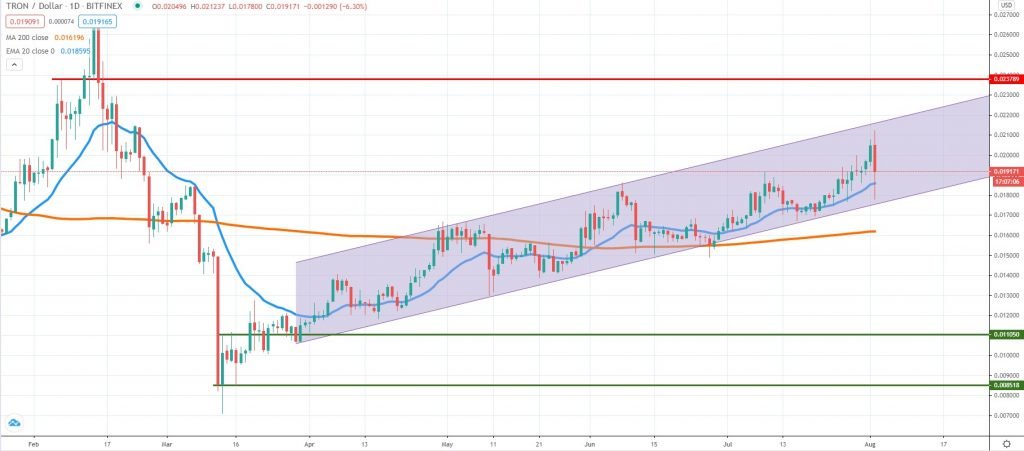
Tron had been moving higher inside an ascending channel formation since the end of March and so far, the sellers were unable to break impulsively below it. However, based on how the current daily candle will close, we could see renewed selling pressure in the following days, in case it will turn out to be a valid engulfing candle.
If that would be the case, the lower line of the channel will be under pressure and the daily 200 MA will be the next key support to watch. If that will break as well, expect more selling towards the 1.1 cents in the next few weeks. As long as the price respects the channel and does not break lower, a new leg up towards the upper line is possible.
Keep in mind that unlike other large-cap tokens, Tron did not make a new 2020 high recently, which means it is one of the underperforming tokens. If selling pressure resumes in the broader market, it might be subject to more downside.


There are no comments at the moment, do you want to add one?
Write a comment