
BTCUSD (Coinbase)
Source: TradingView
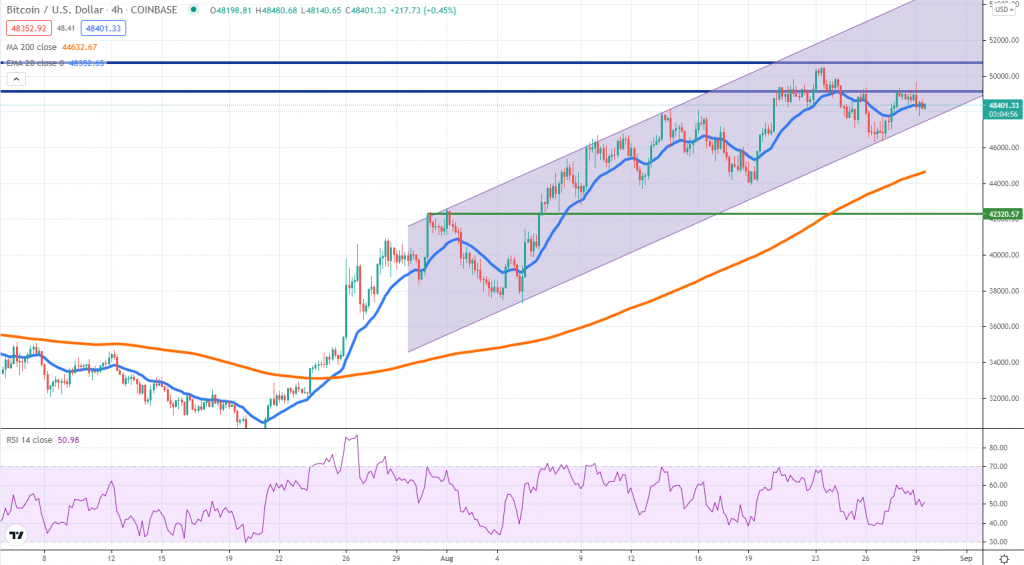
The $50k area turns out to be a stronger resistance for Bitcoin buyers as the price failed to break and hold above it. BTC is trading a little over $48k now that September is near and due to month-end flows, some profit-taking should not be ruled out, after strong gains were seen over the past weeks.
Looking at the 4h chart, the price action is already choppy, communicating the trend is becoming unstable, opening room for a stronger corrective move lower. As you can see on our chart, there is an ascending channel that has been in play since July and a break below it will be an early sign of weakness.
In that case, we suspect Bitcoin could weaken towards the $45k area, where the 200 SMA is located, or $42k, where a key role reversal level can be spotted. As long as the price keeps trading inside the structure, the buyers hold the upper hand and can push it higher.
ETHUSD (Kraken)
Source: TradingView
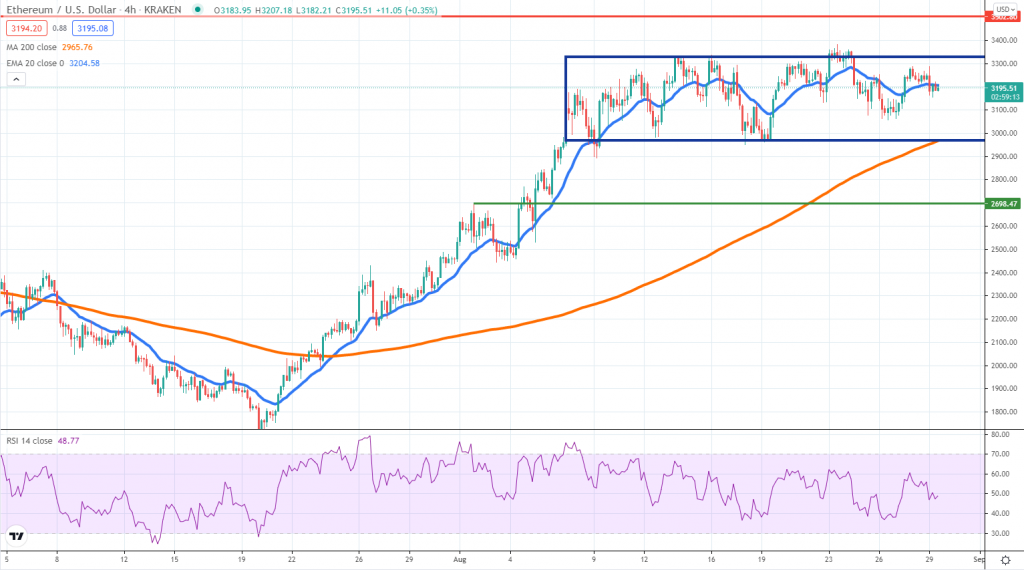
We can notice the same indecision of price when looking at Ether, which is range trading since the beginning of August. After the solid gains of July, buyers had taken a break, but little ground has been given up, leaving the upside intact.
The only risk is if the range breaks on the downside and the formation turns out to be a large topping pattern. In case the selling intensifies, traders should watch whether there is interest to buy around $3,000.
If not, Ether could weaken further, edging towards $2,700, where the first key support is located. On the upside, resistance stands around $3,300 and if the current August highs will be breached, we suspect there could be some struggle to break above $3,500 since that is a key psychological area.
To sum up, the bigger picture suggests there is no order flow imbalance at the time of writing and those looking to gain longer-term exposure should wait and see for further developments. Short-term traders, however, will find plenty of setups near key areas of support or resistance.
XTZUSD (Bitfinex)
Source: TradingView
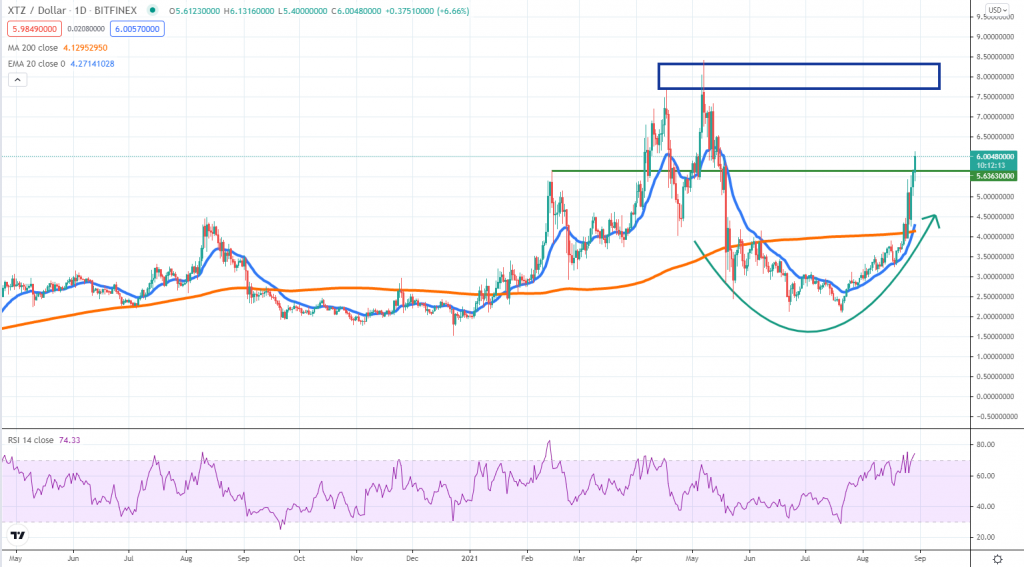
Up more than 55% for the week, Tezos seems to be of great interest to investors. The token is staging a major recovery after losing more than 70% of its value during the bear market. Right now, XTZ is near $6 and threatens to continue towards the area around the all-time high.
The RSI is indeed trading in overbought conditions, but there had been higher readings in the past. Since this is not a consolidating situation, the order flow is favoring further buying and we think XTZ can reach $7.5 or even $8 again.
A corrective move can’t be ruled out and the key area to watch is the daily 200 SMA, currently located near $4. Long-term buyers could wait for a correction towards it in order to get better value. This crypto benefits from a strong reputation and FOMO buying can lead to overextension in the current leg up.


There are no comments at the moment, do you want to add one?
Write a comment