
BTCUSD Bitstamp
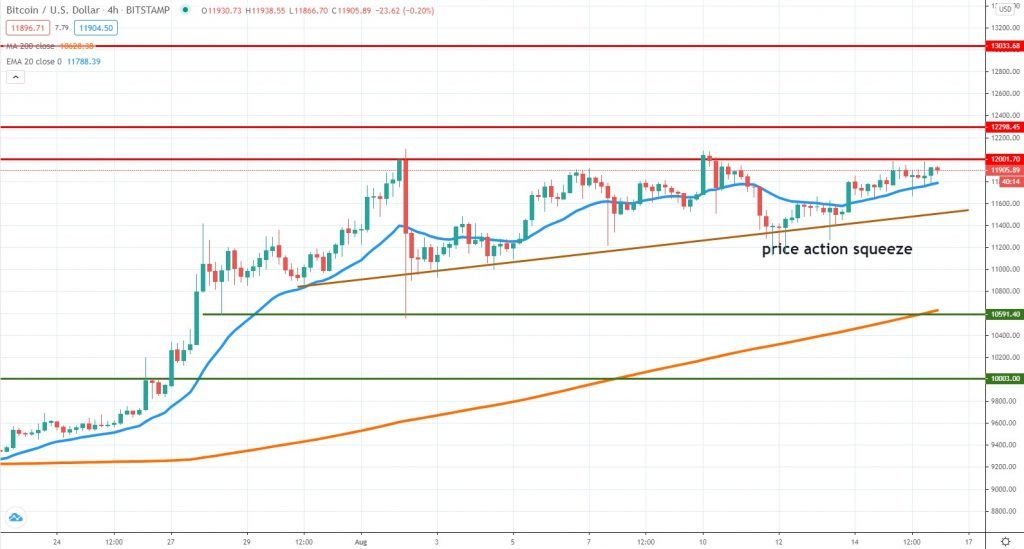
Bitcoin buyers are relentlessly pushing the price towards the key $12,000 area and all of a sudden the price is favoring a breakout and continuation higher. As highlighted in the chart, we’re dealing with a rising triangle or price action squeeze formation, communication buyers are entering at higher levels and pressuring sellers.
This makes a breakout above $12,000 highly probable over the next few days and will mean the next upside targets are located around $12,300 and $13,000. These levels had generated selling pressure last year and the same could happen again.
Our bullish scenario will be negated if Bitcoin breaks below the 4h chart 20 EMA + ascending trend line. That could open more downside towards the 200 SMA and the $10,500 support. However, right now the bullish scenario is the one favored until sellers will show more strength.
ETHUSD Kraken
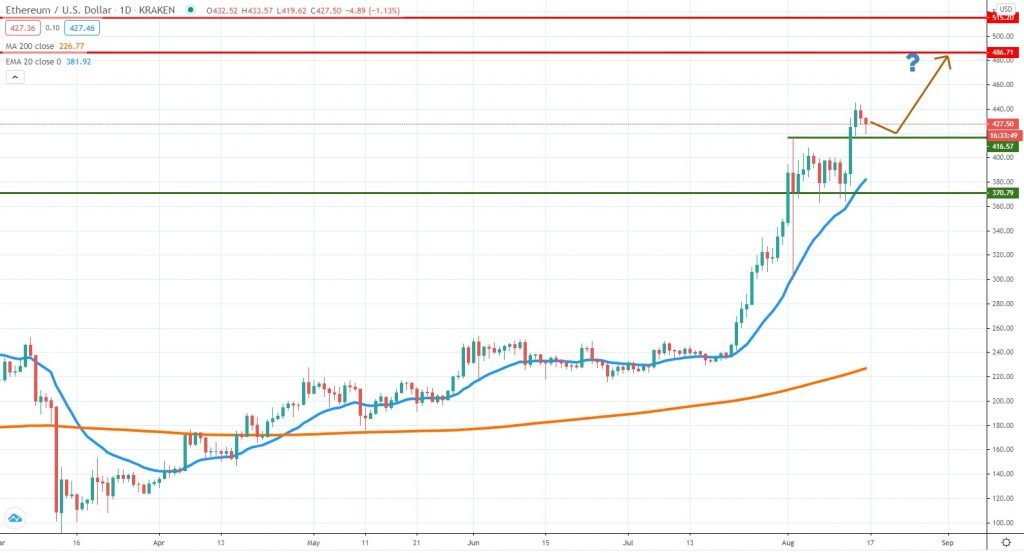
Ether continues to outperform Bitcoin and had already managed to break above the August 2nd highs. Since the price action is posting new higher highs and higher lows, there’s no point to believe the trend will reverse course. Until a reversal signal will show up, Ether still has a lot of room for gains.
Our next upside targets are located around $486 and $512, two areas where the price reacted about two years ago. Given the price had reached levels not seen for such a long time, the strong bullish momentum is pretty obvious.
Any corrective move towards the $370 level, which is also the August 2nd high, is expected to be met with new strong buying. A deeper correction below that level will mean Ether could retest the daily 20 EMA but even if that would happen, it won’t be enough to suggest the bullish leg up had ended.
We need to see a much deeper pullback to suggest sellers are heavily in control. For now, capital is flowing into Ether and the outperformance seems to act as a self-reinforcing pattern, motivating other buyers to join the party as well.
TRXUSD Bitfinex
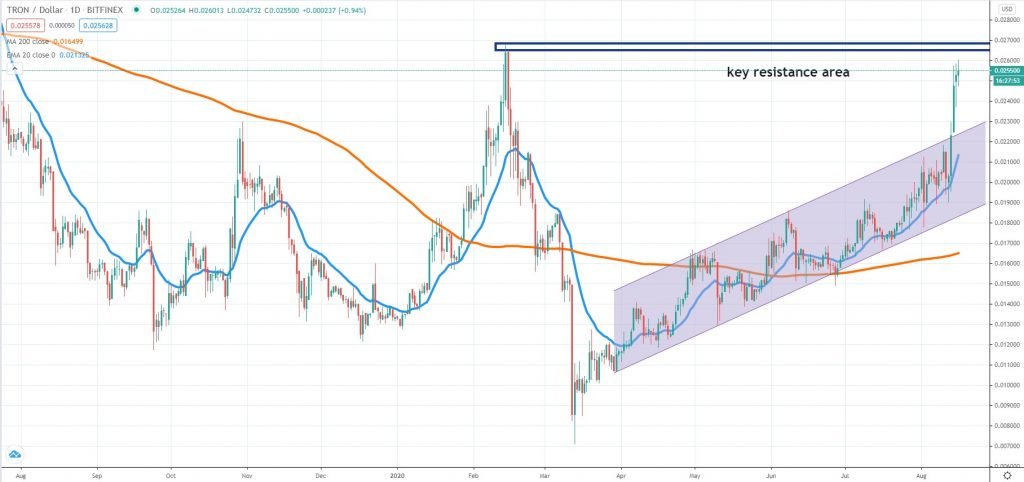
Several weeks ago we’ve covered Tron and at the time mentioned the price was floating inside an ascending channel formation. Three days ago, however, the price broke impulsively above the formation and what followed is a strong wave of buying. Since the March selloff, Tron had been a strong performer and it is now close to the February highs.
We suspect strong resistance might be encountered around 2.6-2.7 cents, so buyers will need to watch out for selling pressure emerging there. Although the outperformance is a good sign for buyers, the price is far from the daily 20 EMA, and combined with strong resistance near, we could start to see a corrective move unwinding.
If a breakout above takes place and sellers have a mild reaction afterward, then the bullish momentum could continue and Tron might be headed towards the 3 cents area. Keep a close eye on how the price will react around the key resistance because that will set the tone for the near term.


There are no comments at the moment, do you want to add one?
Write a comment