
Bitcoin
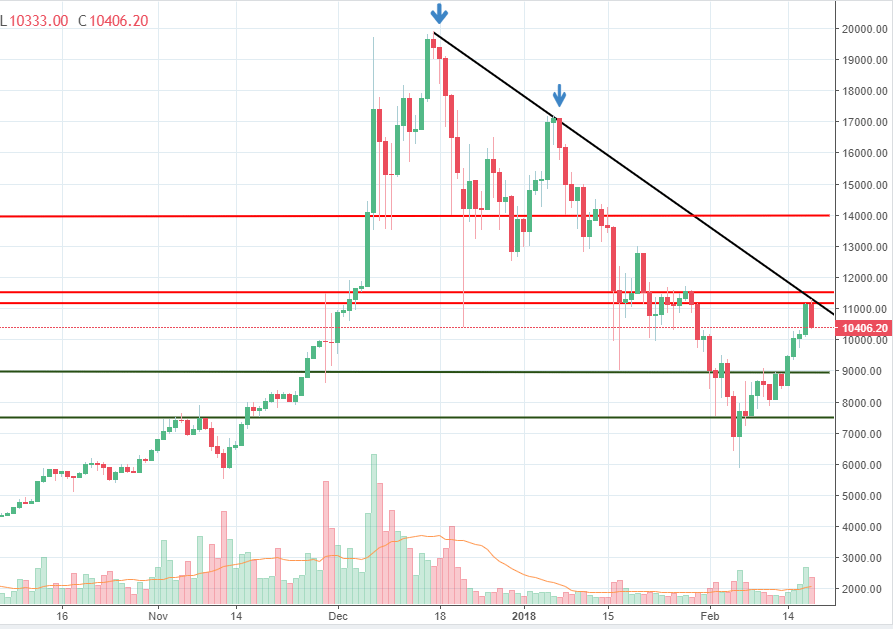
The Bitcoin price had seen the strongest recovery since the beginning of the year during the last week. Investors had been eager to buy after the Bitcoin price reached the 6,000 area on the Coinbase exchange. However, we can see a resistance area formed by the 11,000-11,500 figures, and selling interest can already be seen around that spot. Also, we have drawn a bearish trend that had already been confirmed by two touches.
Since we have a confluence of indicators (the resistance area + the trend line), we could see strong selling interest there, so the upside might be capped. If the buyers will manage to break above the trend line, then further gains towards the 14,000 area are expected.
On the other hand, if the trend line and resistance area will manage to cap the upside and generate enough selling pressure to drive the price downwards, 9,000 and 7,500 could follow.
Source: dailyfx.com
Ripple
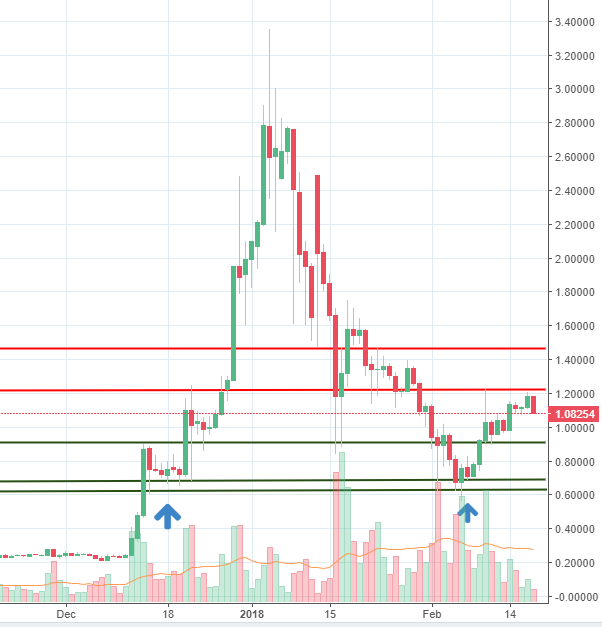
Ripple had been an important gainer for the last week, in line with the market mood. The price was in a good technical position more than a week ago, when it reached the 0.62-0.67 key support area. We can see buyers emerged around that zone back in November 2017 and now the same situation took place. The price is now up more than 50% from the lows, supported by good news related to Western Union, who is now testing the xCurent service provided by the company behind Ripple.
Besides the technical aspects, the fundamentals supported the price that is why we see this good performance. However, we can see resistance around 1.20 as the price is now trading on the downside. The buyers will need to overcome that obstacle in order to push the price towards the 1.46 area.
On the other hand, if the sellers will push the price lower, support is expected around 0.90 and then around our key support area.
Source: dailyfx.com
Litecoin
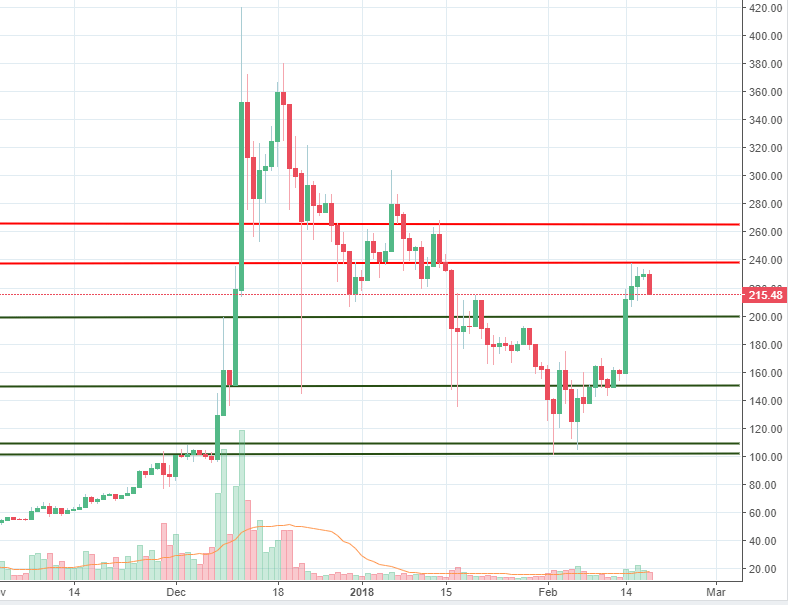
The Litecoin price had the best performance in the last week, surging from 149 to 237, top tick to bottom tick. Since it bottomed out around the 100 area more than a week ago, Litecoin is up more than 100%, which is quite impressive. However, the price action is now beginning to show signs of weakness. Sellers began to drive the price lower around 237 and the selling covers the previous two days of buying. The first short-term support is located around the 200 area. If the sellers will manage to break below it, further slides towards the 150 area could follow.
On the other hand, resistance is expected around 237, where the selling started. If buyers will manage to overcome that obstacle, 265 will be the next target.
Source: dailyfx.com


There are no comments at the moment, do you want to add one?
Write a comment