BTCUSD (Bitstamp)
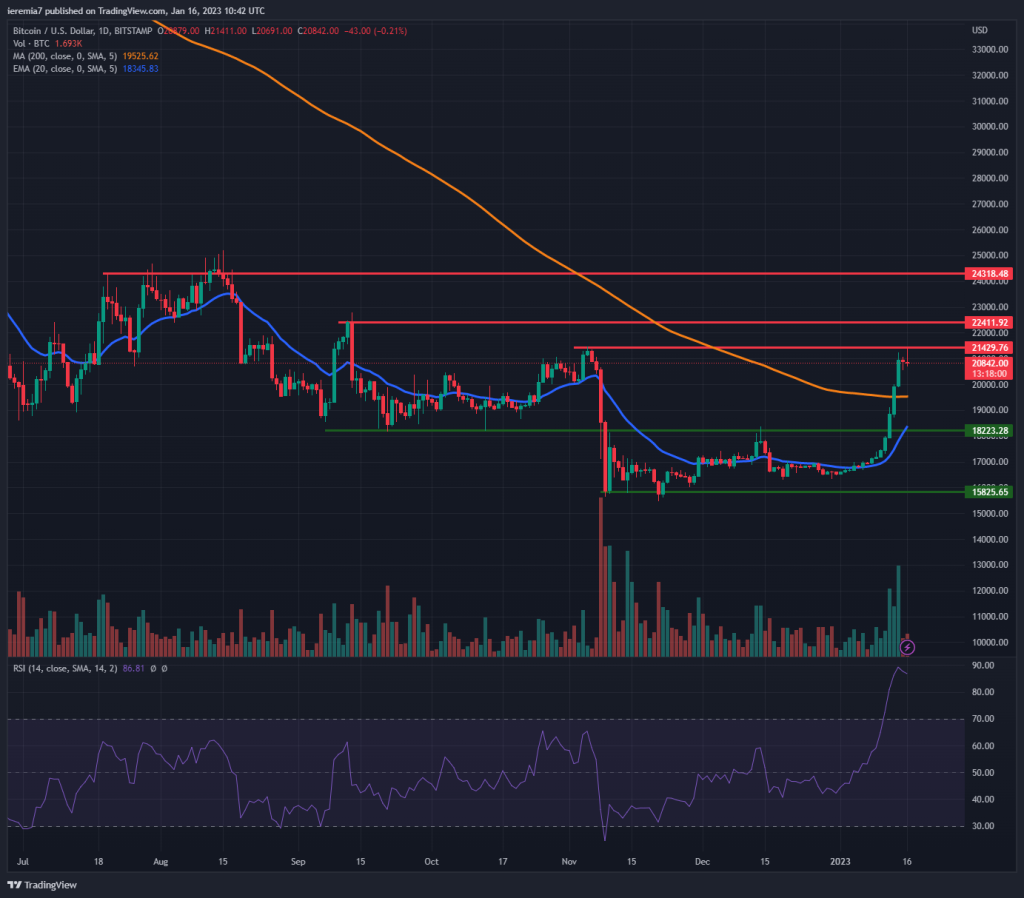
In line with our last week’s forecast, Bitcoin continued to edge up and even managed to exceed our short-term resistance levels. At the time of writing, it seems to be struggling to break above $21,500, which is where an impulsive selloff started at the beginning of November 2022.
On the daily chart, there are 7 consecutive green candles, and combined with rising volume, that suggests there has been increasing buying appetite. However, that doesn’t mean there will be continuous gains and we anticipate a pullback at least toward the daily 200 SMA. If buyers manage to keep the price above it, that should be regarded as a bullish sign.
Upside targets for this week are $22,400 and $24,300. On dips, traders need to watch the 200 SMA on the daily chart and if it fails as support, $18,200 + the 20 EMA will follow then. BTC bounced from extreme oversold conditions but now the daily RSI is trading around 86, leaving the coin vulnerable to short-term pullbacks.
ETHUSD (Kraken)
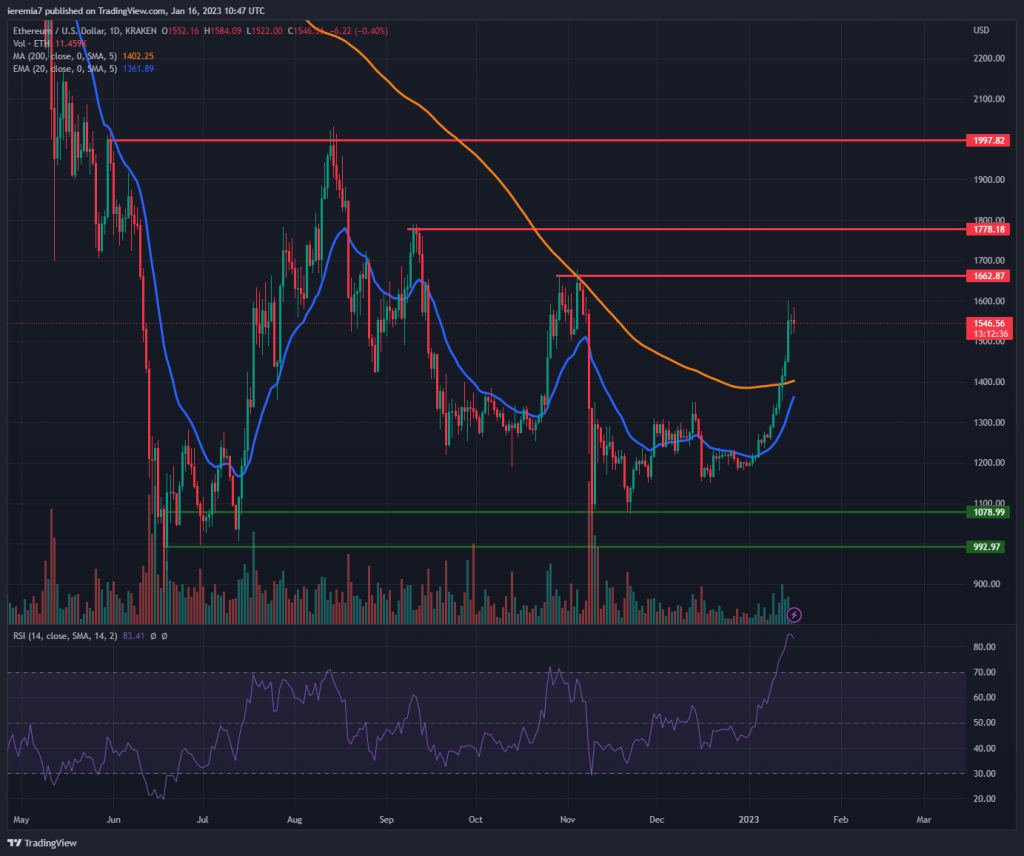
Ether is underperforming Bitcoin, given it did not manage to reach the levels seen at the beginning of November 2022, The token does trade above $1,500 for the first time in 2 months, but while below $1,700, we believe there is still scope for sellers to gain control, at least in the short-term.
The technical picture improved, with the solid gains seen last week and now buyers have reasons to consider increasing their exposure. Same as with BTC, the RSI is overbought on the daily timeframe, which calls for caution. A pullback towards the $1,400 area, where the 200 SMA is currently located might be a better place for bulls.
Conversely, sellers wanting to add short positions might want to wait until ETH reaches $1,700 and does not show signs of breaking out on the upside. A double-bottom formation could be in the making and that means the token price can continue to climb at least towards $2,000 over the next couple of weeks.
SOLUSD (Coinbase)
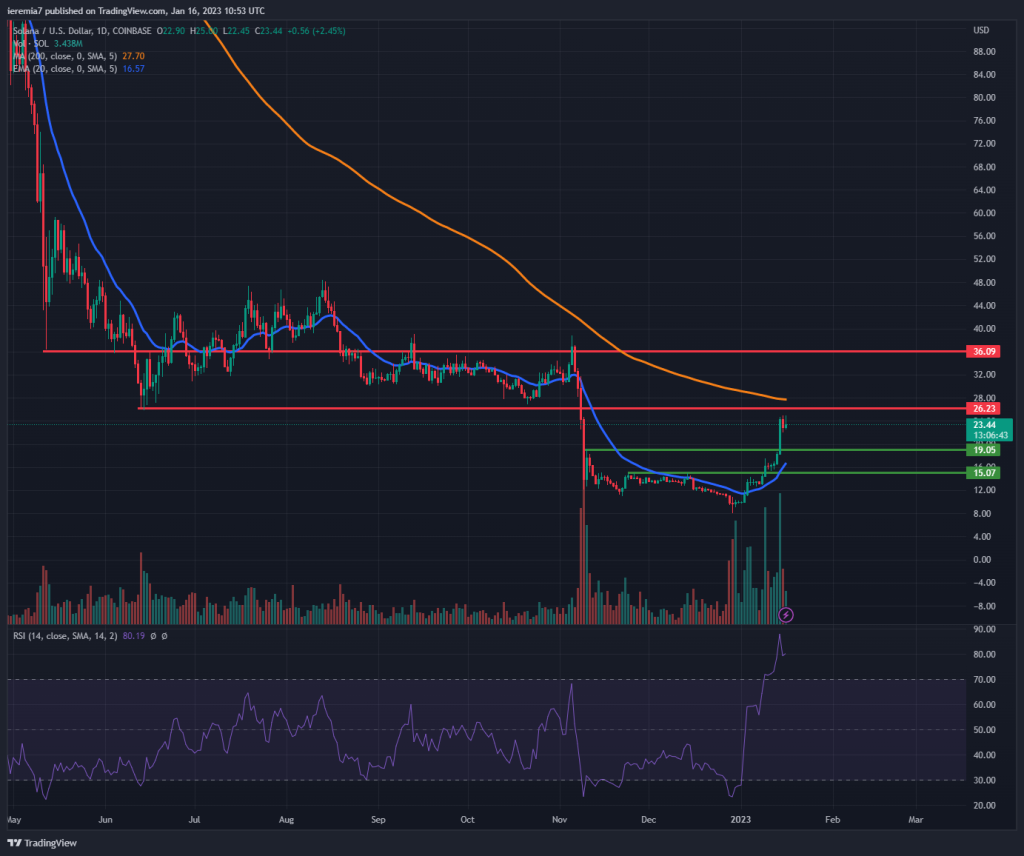
Up over 40% during the last 7 days, Solana is one of the major outperformers when looking at large-cap tokens. Despite the impressive run, we advise buyers to proceed cautiously, since the price is approaching a key resistance area located near $26.5. At the same time, the 200 SMA comes near it, potentially adding extra selling pressure.
A break above that resistance area would be a good sign and will suggest SOL can move higher, towards $36. Failure to break can lead to a pullback on the downside. In this scenario, traders need to watch how the price will perform around $19, the 20 EMA, and $15, in case the selling accelerates.
In case none of the levels above holds, SOL can move impulsively lower. We don’t believe this is the most likely scenario, based on the current technical conditions. The RSI is overbought once again, meaning traders should not be surprised if a pullback unwinds once the price hits $26.


There are no comments at the moment, do you want to add one?
Write a comment