BTCUSD Coinbase

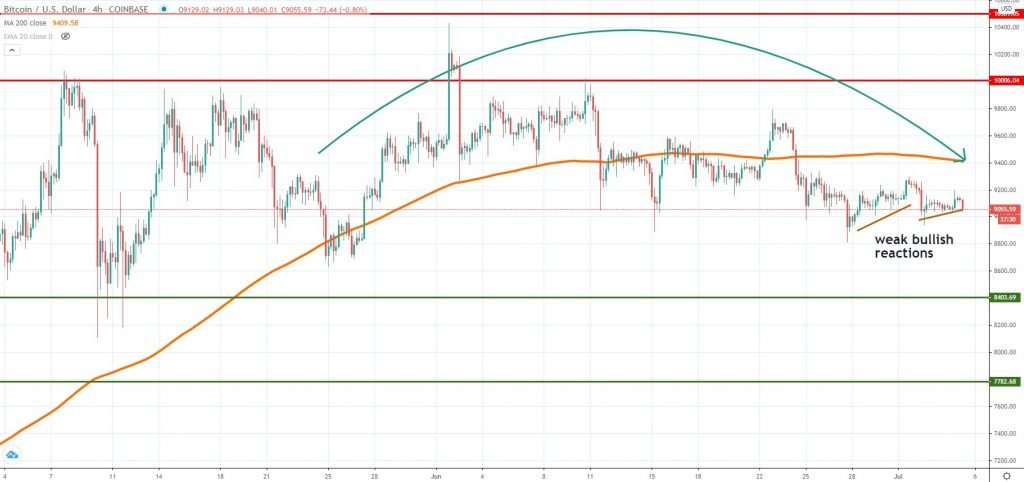
The past week had seen Bitcoin mostly flat, with buyers not managing to hold the short-term gain. The price is close to the level it was when we wrote our past weekly analysis and that’s not a very encouraging sign, viewed from a broader picture. Bitcoin continues to trade below the 4h chart 200 MA and because it had such a weak performance this past week, we continue to believe that it will head south towards the $8,400 key support area.
If that will hold, then Bitcoin will continue to be inside the range and it’s possible to see it rising higher. However, due to sustained weakness in the stock markets, our view is that Bitcoin could remain under pressure for at least a few weeks, in the absence of no catalyzer for risk sentiment. Buyers should look to sell on brief rallies, and we believe the 4h 200 MA will be the line in the sand moving forward.
ETHUSD Kraken

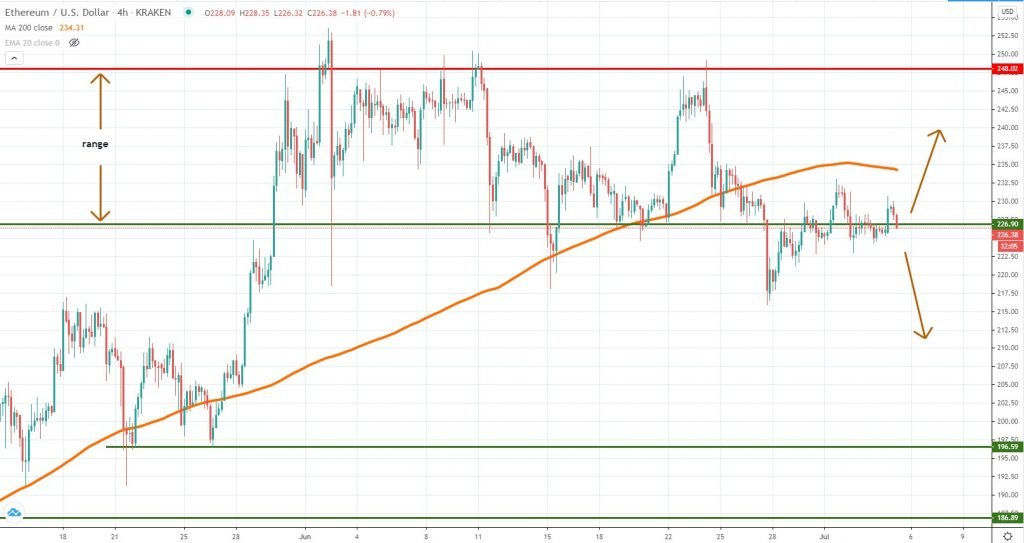
As we’ve mentioned in our last analysis, Ether had retested the broken range, but buyers were unable to sustain a longer rally. Because of that, we continue to believe this is a breakout-pullback setup, with sellers as the clear favorites in the next few days or weeks. As long as they will treat the $226 area as resistance, we expect the price to weaken further.
If the bearish picture will continue to be in play, our first target is located around the $215-$210 area, followed by more downside potential towards $196. The overall price action structure is not favorable for bulls as we see a series of lower lows and lower highs. At this point, only a breakout above $250 could be enough to revive strong bullish momentum.
There is a possibility, though, that buyers will manage to rotate around $226 and move the price higher. In that case, the first key resistance to watch is the 4h chart 200 moving average. A break above it will suggest a short-term change in momentum and might be beneficial for more upside gains.
STRUSDT Poloniex

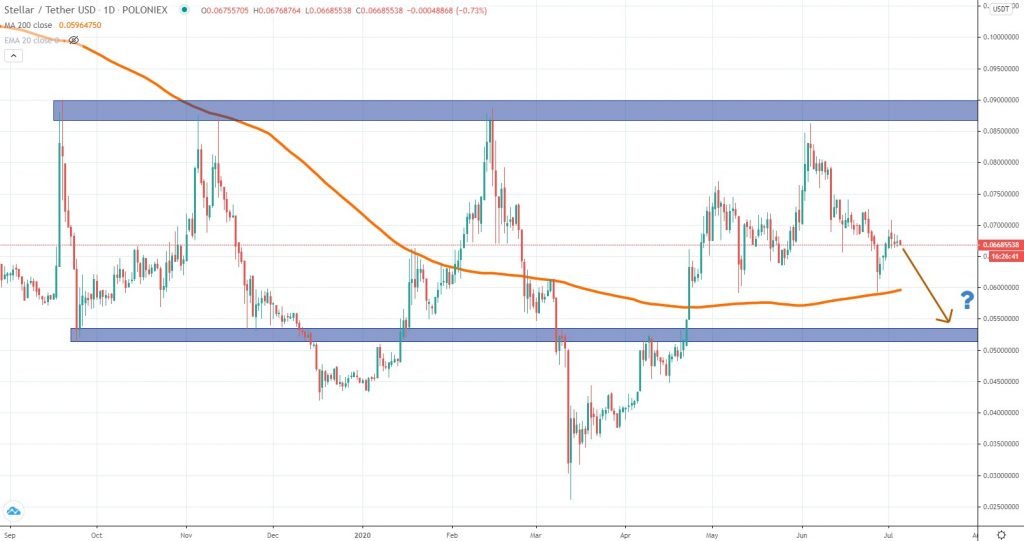
Since mid-March, Stellar had been a big gainer, rising by more than 150% in value, but the rally failed before reaching the upper area of a big range we’ve talked several times since September 2019. If we analyze the price action performance since the beginning of June, the sellers are the ones clearly in control and because of that, we suspect there’s more downside ahead, with support around the daily 200 moving average and the bottom of the range.
Could this be a long-term bottoming formation for Stellar? It is possible, but at this point, we need more confirmation the sellers are only in control for the short-term. If impulsive selling will accelerate, we don’t exclude a retest of the March lows. Watch how the range will play out and whether buyers will step in again around the bottom of it, in case the price continues to weaken further.


There are no comments at the moment, do you want to add one?
Write a comment