
BTCUSD Coinbase
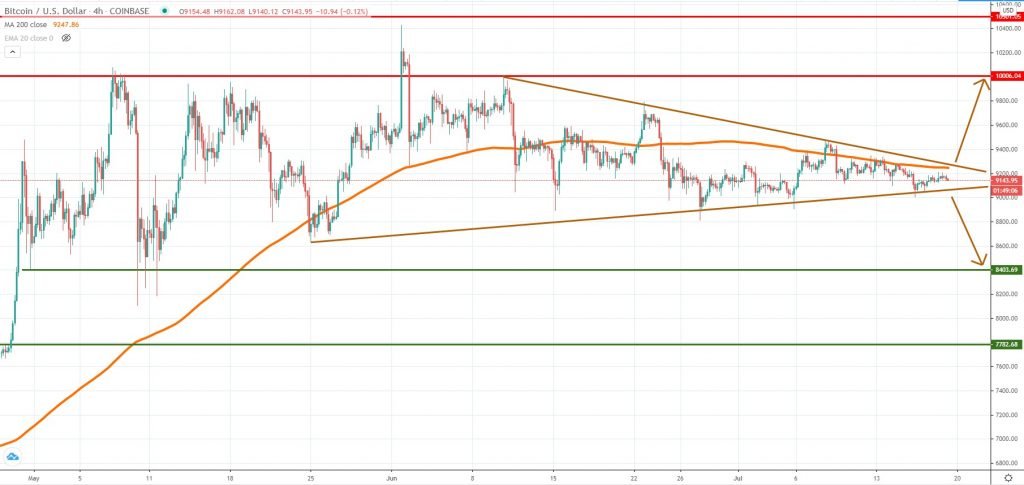
The Bitcoin price action continues to be locked inside a short-term triangle formation and the diminishing volatility suggests an impulsive move is not far away. Since the structure is close to being filled, we suspect a stronger move will start to unfold during the next week. If the price will break on the downside, our first downside target is located around $8,400, with more room to go towards $7,700.
In case Bitcoin buyers will emerge impulsively and break above the 4h chart 200 MA + the triangle, the bullish run will continue and the next hurdle will be $10,000. Only a break above the June 1st high will communicate the buyers had regained full control over the price action.
Following two months of choppy performance, both sides of the market are now on their toes. This is a textbook price action development and in a short period, we believe volatility will start to explode again.
ETHUSD Kraken
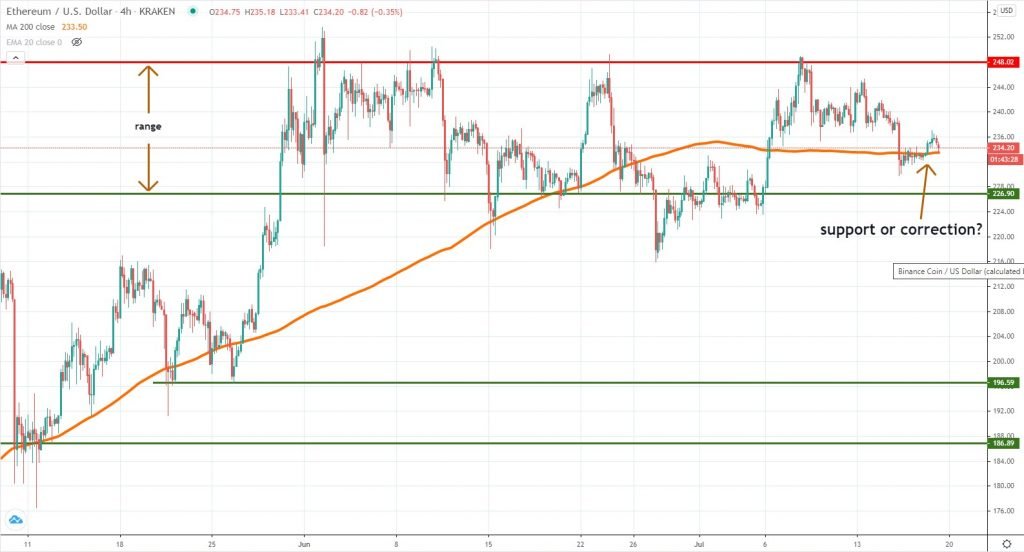
Even though Ether had been more active during the past month and a half, the picture is also suggesting indecision among market participants. Our range structure is still in play and as we’ve anticipated last week, the price weakened lower since buyers were unable to break above. Right now we’re noticing some short-term support around the 4h chart 200 MA, but it’s still not certain whether that’s a mild correction or an accumulation of buyers.
It’s important to see the price moving higher and in that case, we should expect more pressure to build on the $248 key resistance line. On a break below the 200 MA, the $226 support will follow next. We should keep in mind the Bitcoin performance, as well, because that could dictate the tone for the entire market.
The range is in play since May 30th and given the price had been trading inside it for so long, shows the market had taken a break following the impressive run higher since March.
LINKUSD Kraken
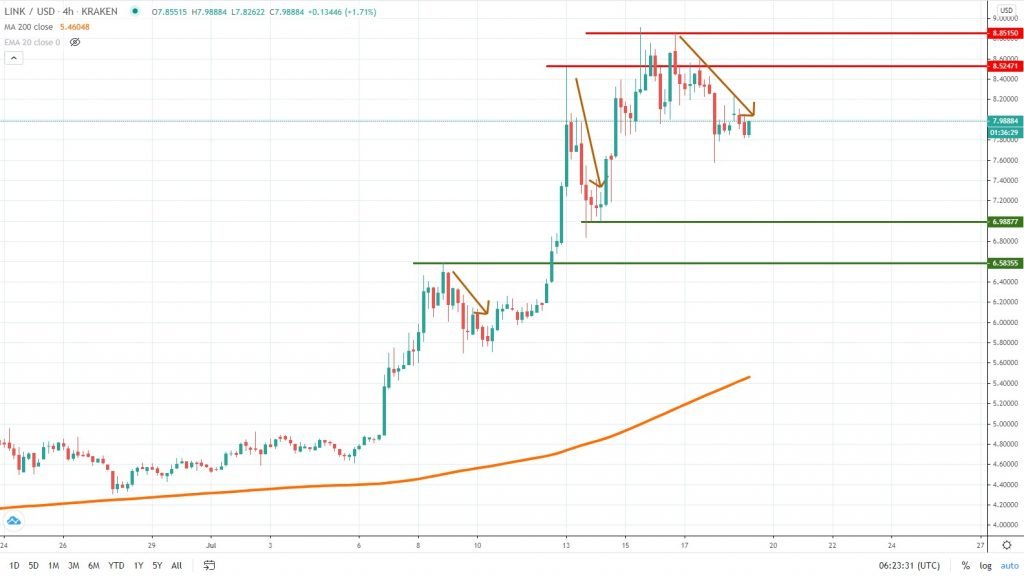
This is the first time we’ve included Chainlink in our weekly analysis, mainly because the token had been a major performer in the past month. We can easily notice the massive surge in valuation, which, from our point of view, is a typical “pump”, given there was no fundamental change with the blockchain recently.
Speaking of the technical analysis, stronger selling interest seems to be emerging, communicating these high valuations are not accepted by the market. Dealing with such volatile conditions is not easy and it is important to watch how the price reacts to key technical levels.
If a new move on the upside starts to build up, watch for selling activity around $8.52 and $8.80. Impulsive buying pressure could push the LINK price towards the key psychological area located around $10.
In case the price will weaken further, we expect support to emerge around $7 and $6.5. However, if Chainlink weakens towards either of those levels, it will confirm the dump had started, and looking for selling opportunities will be the next key strategy.


There are no comments at the moment, do you want to add one?
Write a comment