
BTCUSD Bitstamp
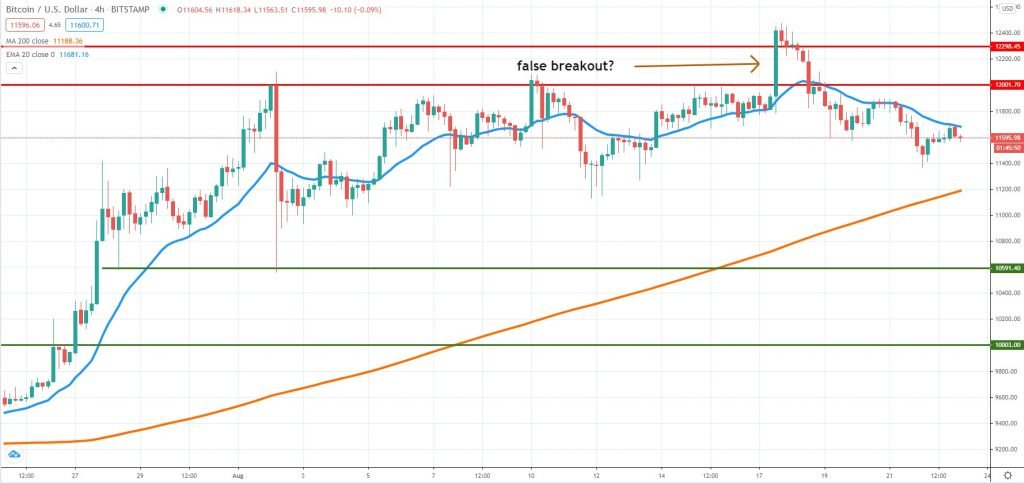
On August 17th, Bitcoin finally managed to break above $12,000 but the follow up had been contrary to what bulls might have expected. There wasn’t enough momentum to keep the price action extending higher and not only that, but Bitcoin is now in the negative on a weekly basis.
A week ago we’ve highlighted both $12,000 and $12,300 as key resistance levels and it is possible that both might have formed a critical barrier against further upside. Right now, sellers are in control over the order flow in the short-term, because the price is trading below the 4h chart 20 EMA, treating it as resistance.
If the corrective move continues, we expect Bitcoin to find support around $11,200, where the 4h chart 200 MA is located, or if selling intensifies, it is not excluded to revisit the $10,500 support. A surge on the upside will expose again the area around $12,000 – $12,300, where sellers could rejoin impulsively.
ETHUSD Kraken
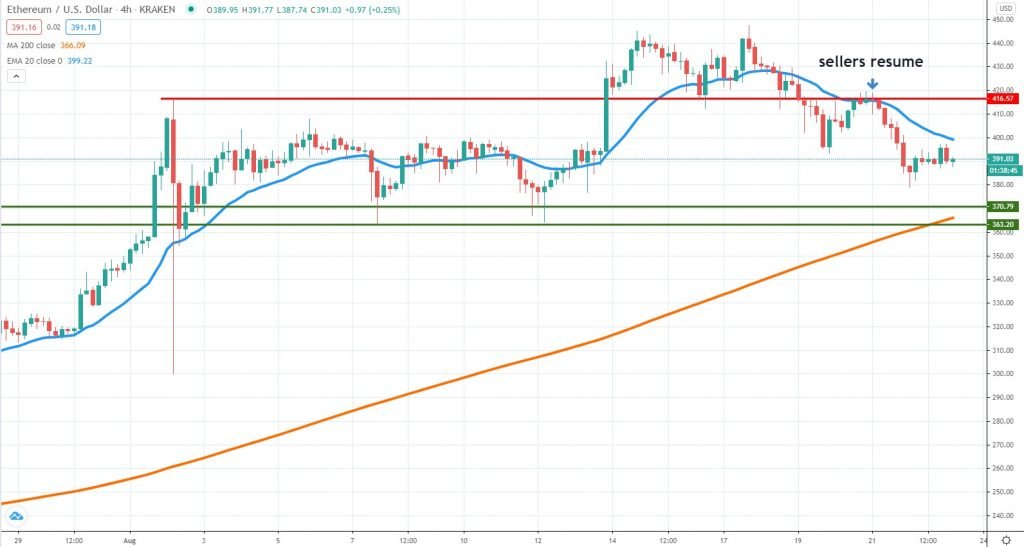
Ether had been trading in sync with Bitcoin over the past week, also weakening following a breakout above the August 2nd high. We can easily notice how the market respected that level several times during the past two weeks, with buyers active when the price was above it, only to see sellers gain control once below.
Reaching almost $450 was not a sustainable price, given the price performance and market participants had been pushing Ether lower, currently trading around $391. Looking ahead, we suspect more weakness will follow, as long as the price will trade below the 4h chart 20 EMA.
The key support area to watch is formed by $363-$370 + the 4h chart 200 MA. There’s a confluence of indicators there that could result in increased buying activity. An impulsive break lower is the most negative scenario and would expose the $300 area.
Buyers should look for a change in the price action structure, in particular a break above the 20 EMA. If that takes place, $416 will be the short-term upside target. Watch how it reacts there for further clues on the next direction.
LTCUSD Coinbase
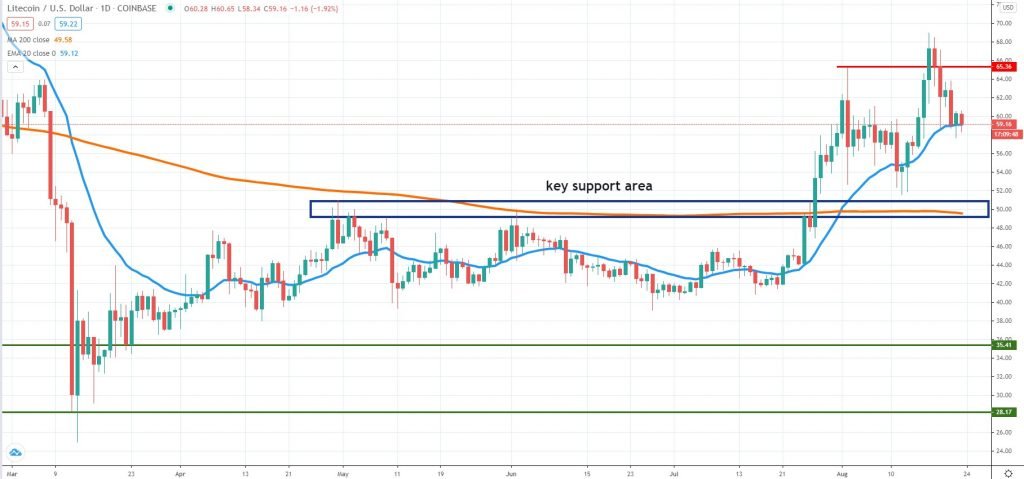
Even though the first day of the week started with a breakout above the August 2nd high, Litecoin is heavily in the negative on Sunday morning. This is the sharpest decline since the first half of May and might suggest that the bullish run might be close to its ending.
For now, buyers had managed to prevent a strong breakout below the daily 20 EMA and as long as that does not happen, we could expect to see a rebound higher. The $62 area would be the key resistance to watch if that would be the case.
If the price breaks below and buyers don’t show strength, then it is very likely more downside will follow. The key support area located between $49-$51 is to be watched for further clues. We expect buyers to react strongly around it, especially if we consider the daily 200 MA is also located there.


There are no comments at the moment, do you want to add one?
Write a comment