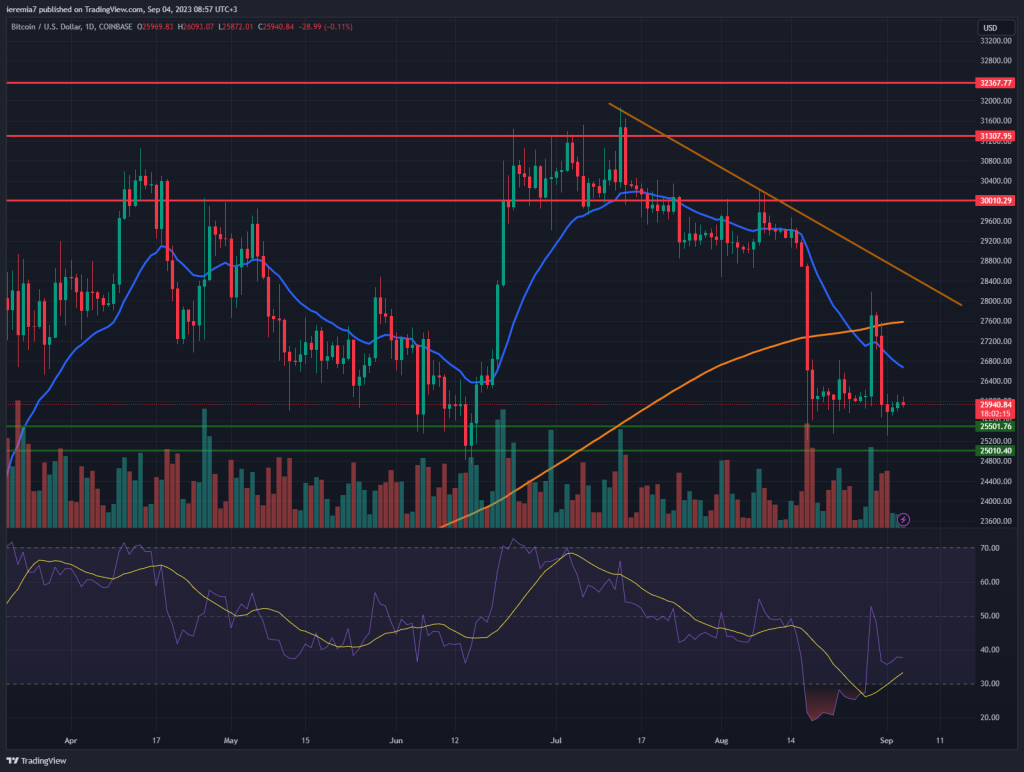
BTCUSD (Coinbase)
Source: TradingView
Last week we saw a pick-up in bullish sentiment after Grayscale managed to stage a court win against the SEC. This could be an early indication that a US-listed BTC ETF is not too far, so the enthusiasm might have been justified.
Still, the market wasn’t able to hold the gains. In fact, when we look at the daily chart, the 200 SMA has been treated as a pivoting area, which is a bearish sign. Moving forward, $25.5k – $25k is a pocket of support where we expect bullish interest to rise. If the market continues to drift lower, the move could extend towards $24k.
On the other hand, if Bitcoin starts to rise again, you should watch how the price will relate to the 20 EMA and 200 SMA. Since mid-July those two have acted as dynamic resistance areas. The context is not different right now, so we need to see a break and hold above them.
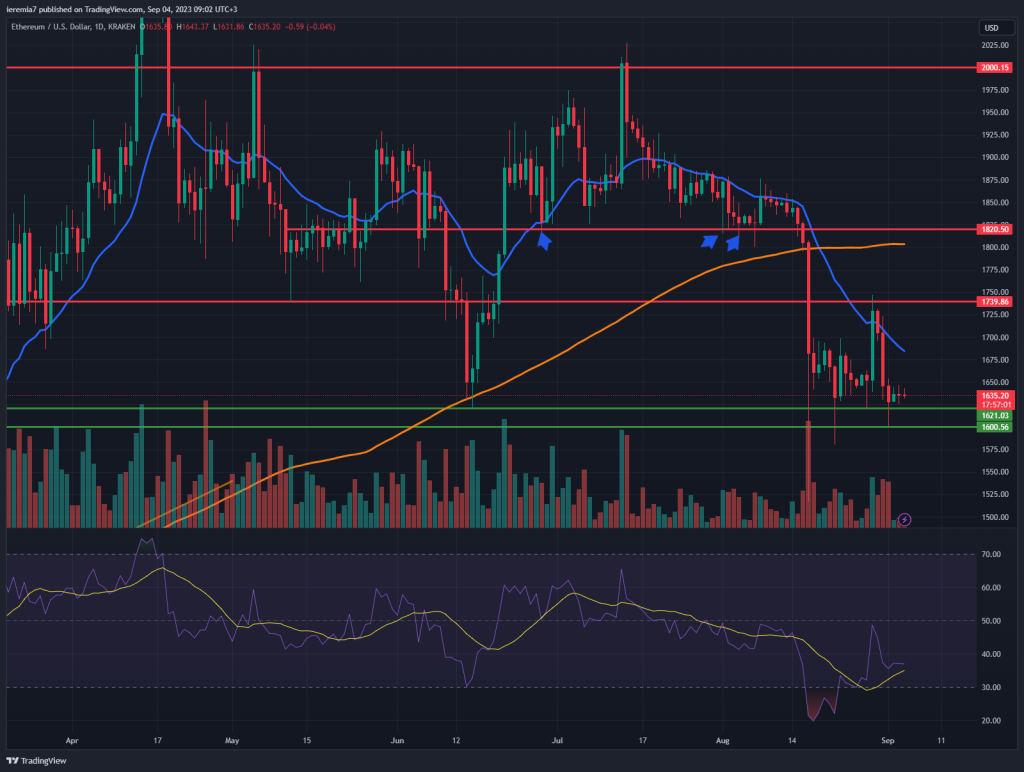
ETHUSD (Kraken)
Source: TradingView
Ether followed the same script as Bitcoin – jumped to the 200 SMA and then erased all the losses. However, it looks like the $1,600 is a strong support, considering that’s where selling stalled three days ago.
Technically speaking, the latest wave of selling breached below the June lows. That means we have a lower low, which is specific when the market is in a downturn. Although bounces can’t be ruled out, the market will need new signs that this is just a pullback inside a bull run.
For the time being at least, we don’t advise taking long-term upside trades. You can look for short-term opportunities around the $1,600 support. On the upside, the 20 SMA is the cap that held since the end of July. The market breaking above it impulsively will be a welcoming sign for buyers. Broadly speaking, we view ETH locked in a range between $1,600 and $1,740. A breakout on either side should be followed by more flows chasing the break.
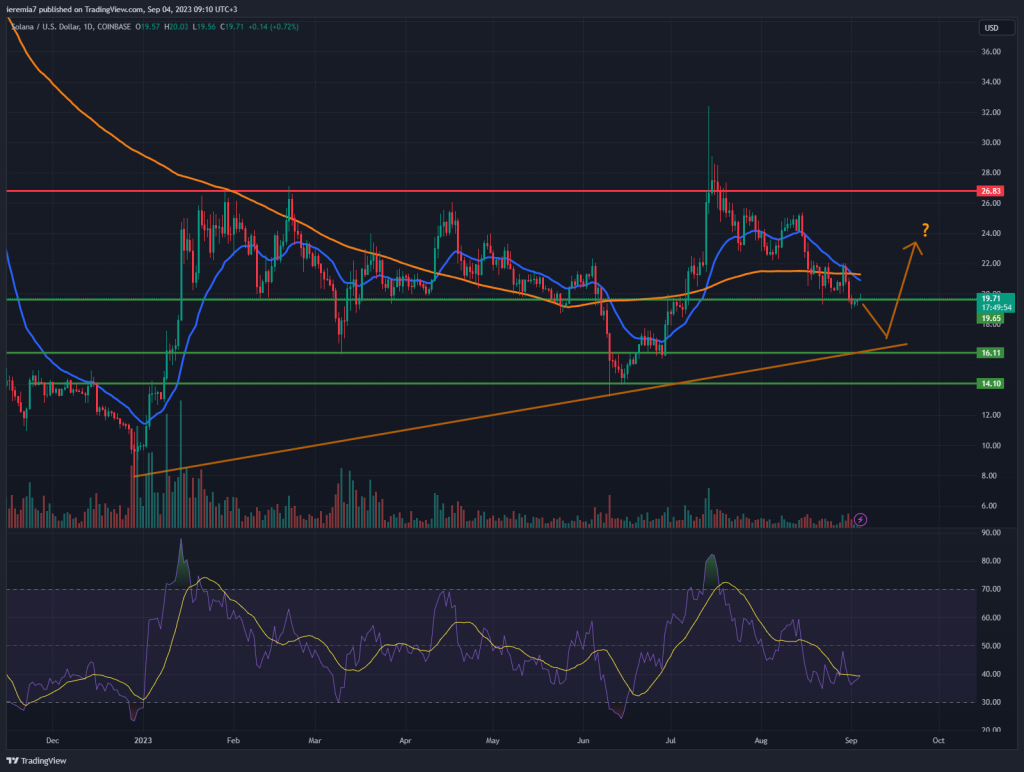
SOLUSD (Coinbase)
Source: TradingView
Solana was down approximately 3% last week, but we would like to bring it up today because the setup occurring might be favorable for bulls in the upcoming weeks. As you can see, from the chart, the coin seems to be bottoming after an impulsive drop and despite elevated choppiness, higher highs and higher lows occurred.
With that being the case, we view the $16 area as a strong support. That’s where an ascending trend line + prior swing low intersect, which means a confluence of buying interest. Even though SOL has not been able to hold above $26 in July, the breakout above that level was a good development.
The price recently dropped below the daily 200 SMA, which can be treated as a bearish sign. However, that happened in the past and buyers were confident to buy cheap. Our bullish view will be negated only if Solana breaks and holds below $13. We will expect more weakness towards the December 2022 lows in that scenario.


There are no comments at the moment, do you want to add one?
Write a comment