
BTCUSD Coinbase
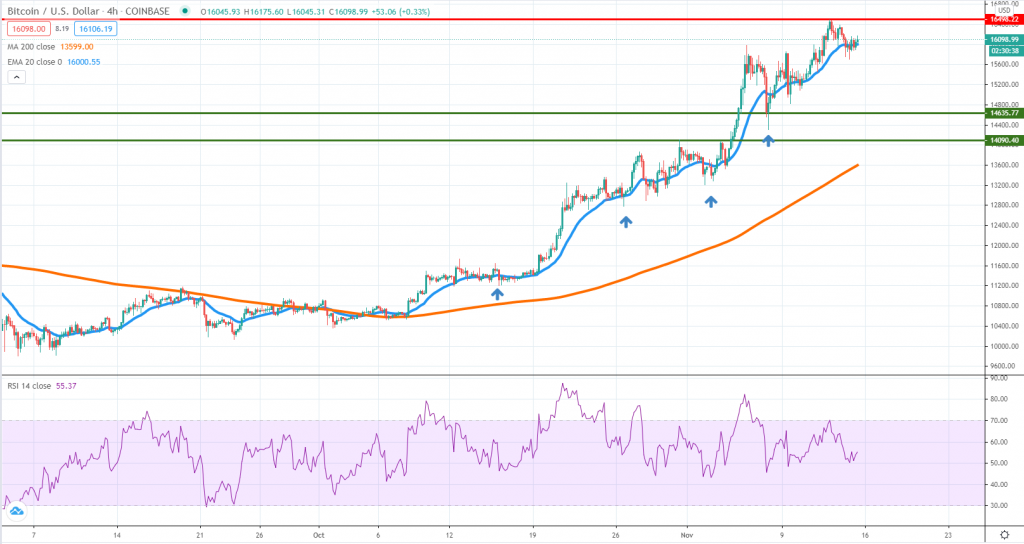
Bitcoin continues to go up relentlessly and the price action structure still does not show any sign of weakening bullish momentum. As you can see from our chart, the price is trending above the 4h chart 20 EMA, finding support multiple times since October each time the sellers drove it down towards the moving average.
With that in mind, the near-term resistance level to watch is $16,500 and if the buyers will break above that as well, then $17,000 and $17,500 will be next. Taking the other side of the market right now would be extremely risky, given how biased the order flow looks to the buy-side.
Breaking below the 20 EMA followed by a weak response from buyers might suggest some short-term correction, but support is expected to arise around $14,600 or $14,000. After multiple weeks in a row of gains, there is still a high interest in Bitcoin, and talks about new all-time highs are already spreading.
ETHUSD Kraken
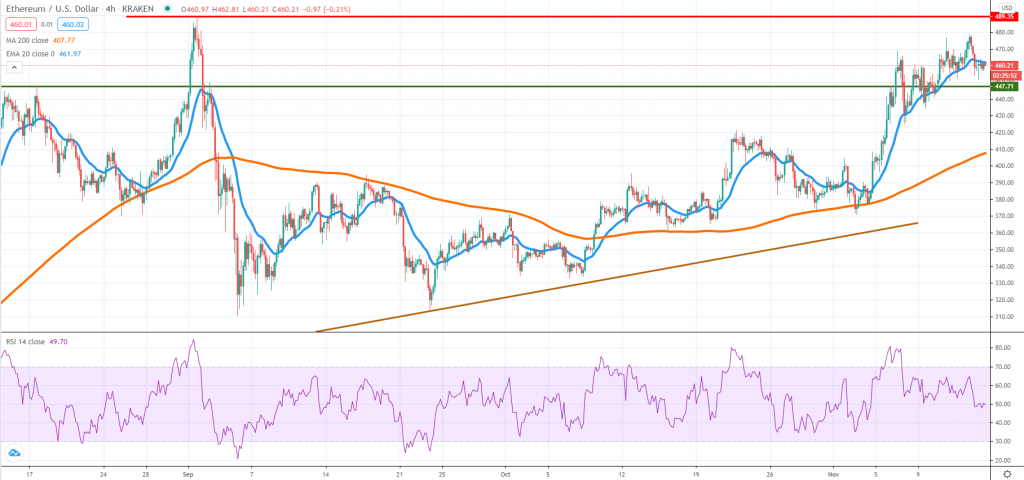
Ether is slowly but surely heading towards the September highs and based on the current price action structure, it would be only a matter of days until the buyers will manage to retest the $490 area.
We don’t see the same impulsive buying as with Bitcoin, but buyers are still managing to hold their ground around the 4h chart 20 EMA which is suggesting the bullish momentum continues to drive the flow. Another good development for buyers comes from the fact that the price broke above $447 and did not break back below it, suggesting that is from now on a support level.
Only a breakout below it could suggest that some added selling can push Ether towards $420 or the 4h chart 200 MA, but as things stand now, the next week will see the token continue to rise higher.
ATOMUSD Kraken
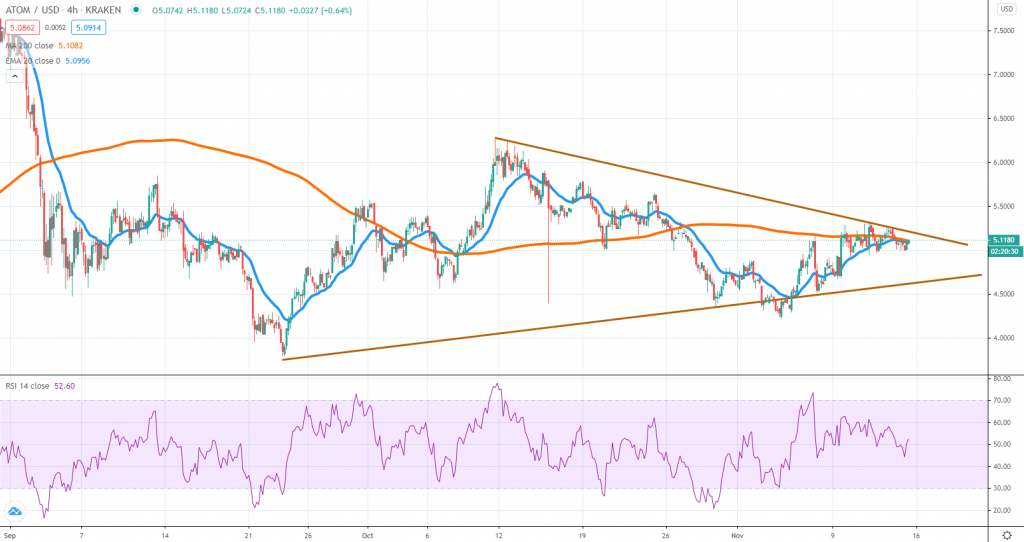
Currently the 23rd largest cryptocurrency in the world, ATOM posted some solid gains during the past 7 days, rising by an aggregate of 7%. Looking at the price action we can easily notice that the price is trading inside a triangle formation, with the breakout expected to show the next dominant direction.
The price seems to be struggling to break above the 4h chart 200 MA but once that’s cleared, we assume a breakout higher will be the most likely scenario. In that case, we suspect the price can start a longer bullish leg up, which could send the price towards $6 or even higher towards $7.5 where the next significant resistance area is located.
In case buyers will fail around the 200 MA, then we suspect the lower line of the triangle will fall under pressure again. The RSI is trading around 50 so from this point forward, anything can happen with the price, which means traders should wait and see how the market will react around the key areas mentioned above.


There are no comments at the moment, do you want to add one?
Write a comment