
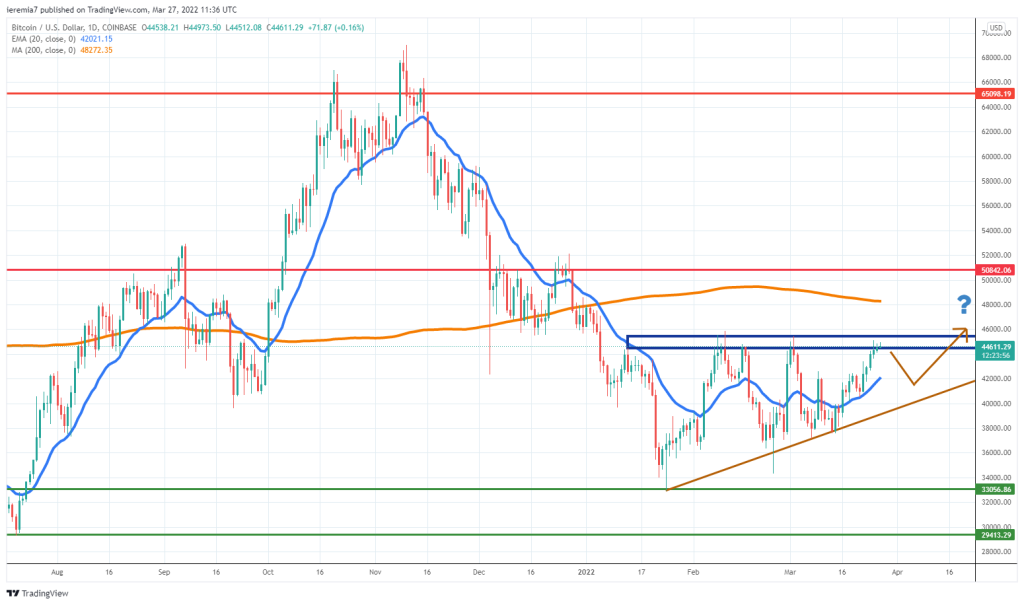
BTCUSD (Coinbase)
Source: TradingView
In line with our last week’s expectations, Bitcoin continued to move up and is now trading inside a resistance area around $44.5k – $45.5k, a place where it got rejected three times already. Because sellers were active there in the past, we should not exclude a pullback towards the daily 20 EMA, or even lower, where a short-term ascending trend line has been confirmed.
The good news, though, is that now buyers are driving the order flow, so if they can manage to push the market further we might see a recovery extending into April. But, some key areas need to be breached, including the daily 200 SMA, which is where the biggest challenge lies.
Speaking of the bearish scenario, we should start to see strong red candles on the daily chart, combined with a breakout below the 20 EMA and also the trend line. If that would be the case, Bitcoin is poised for a retest of the $33k support area once again. The past week’s price action performance is quite encouraging, but we maintain a certain degree of caution, given how fast the sentiment could deteriorate.
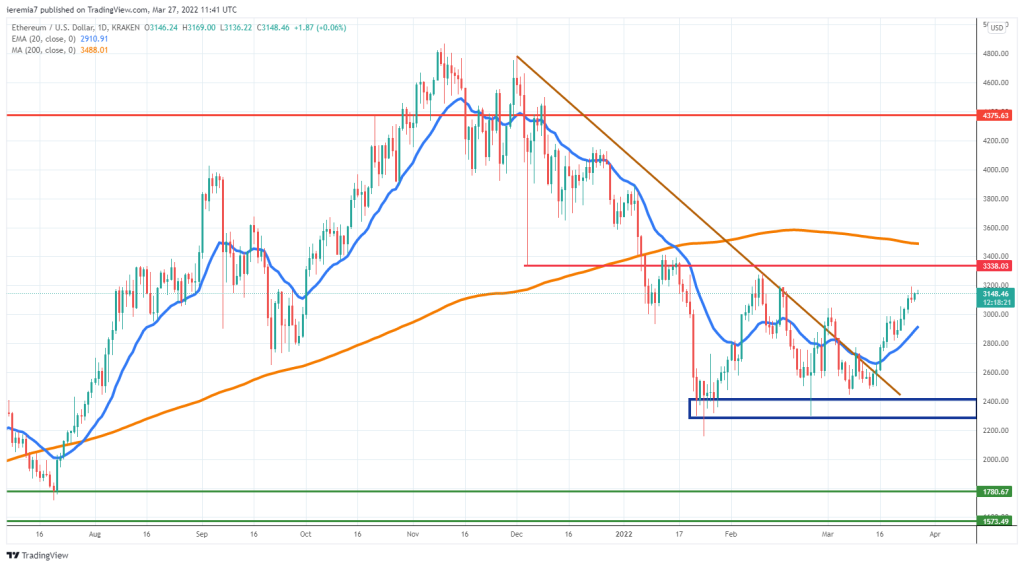
ETHUSD (Kraken)
Source: TradingView
Conditions are positive for bulls when it comes to Ether as well because 11 of the past 13 daily candles closed green. The price broke above the $3k psychological area four days ago and now it turns out $3.4k might be in the cards.
Volatility is lower since daily ranges have compressed. Such twists and turns happened many times in the crypto space, so at some point in time, there will be something triggering larger price swings.
As March is wrapping up, traders should monitor how ETH will perform around the above-mentioned resistance. Breaching above will open some little more space towards the 200 SMA. The price is trending above the daily 20 EMA so the momentum is still in favor of buyers.
We would like to see a breakout above the February highs and follow-through selling after that, because it would be confirmation buyers are back in full force. Hesitation and choppier price action in the days to come would be an early sign of weakness.
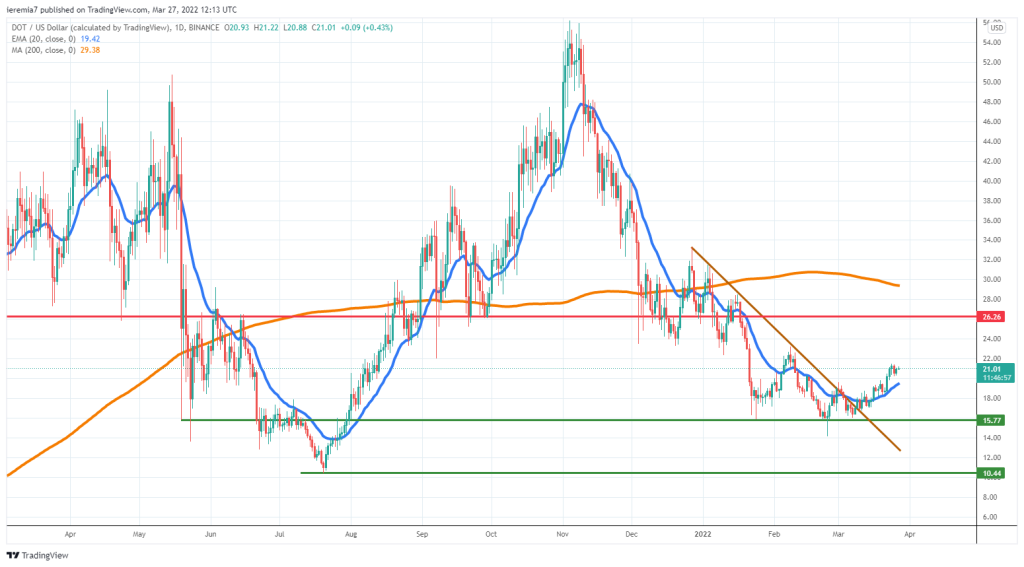
DOTUSD (Binance)
Source: TradingView
Up more than 10% over the past week, Polkadot seems to be another crypto that got the traders’ attention. The price is now treating the daily 20 EMA as support, which means there might be some more upside unexplored.
Technically, since the break above a trend line, buyers hold the upper hand so if the price manages to break above $22, the next resistance to watch would be $26.
The good news is that the price found support before reaching the July 2021 low, so that means buyers were eager to get involved even at higher levels. As long as the price will keep trading above the daily 20 EMA, we believe the bullish sentiment will prevail.
Otherwise, a breakout below it will mean DOT can revisit $15, a short-term swing point. Breaking lower will expose the $10 mark, where a strong bullish move started during the summer of last year.


There are no comments at the moment, do you want to add one?
Write a comment