
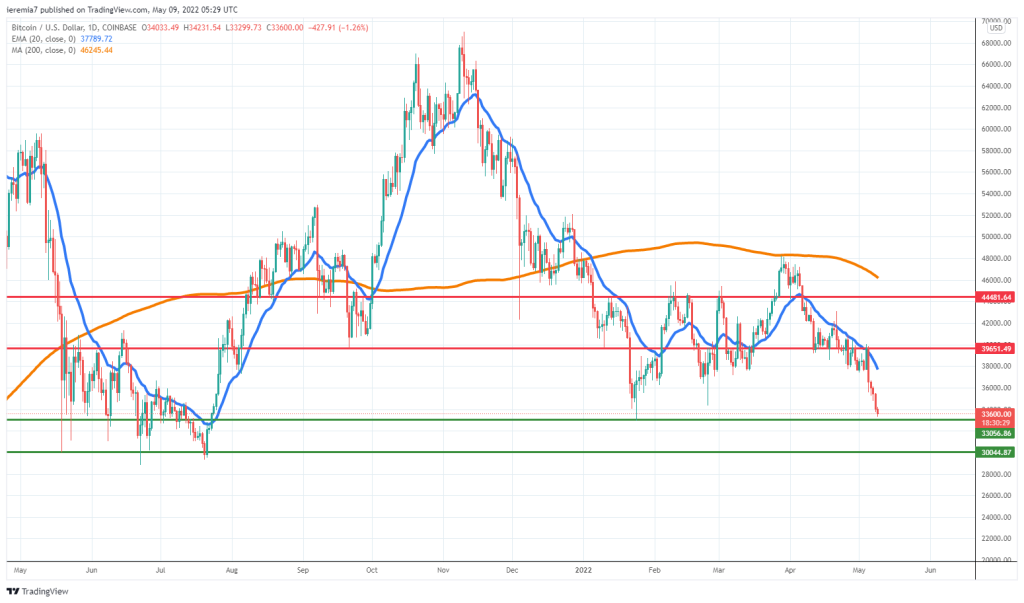
BTCUSD (Coinbase)
Source: TradingView
The Bitcoin selloff accelerated and for 4 days in a row, the largest crypto closed with losses when looking at the daily chart. At the time of writing, BTC is close to retesting the January 24th low, which is also the current yearly low.
A temporary bounce might happen there, but given the impulsive selling, a breakout and continuation is the most likely scenario. If that will be the case, we expect Bitcoin to continue towards the $30,000 key support area, where we can see strong buying interest in June-July 2021.
In case the sentiment starts to improve, the upside is limited right now, and the first level to watch is the daily 20 EMA. The price has been trending below it for a couple of weeks and only a strong break above it might revive some optimism.
With the US Dollar breaking higher, Treasury yields at levels not seen in years, and a poor risk appetite, the prospects for Bitcoin are bearish. We don’t advise taking long positions at this point, as things could get worse before they get better.
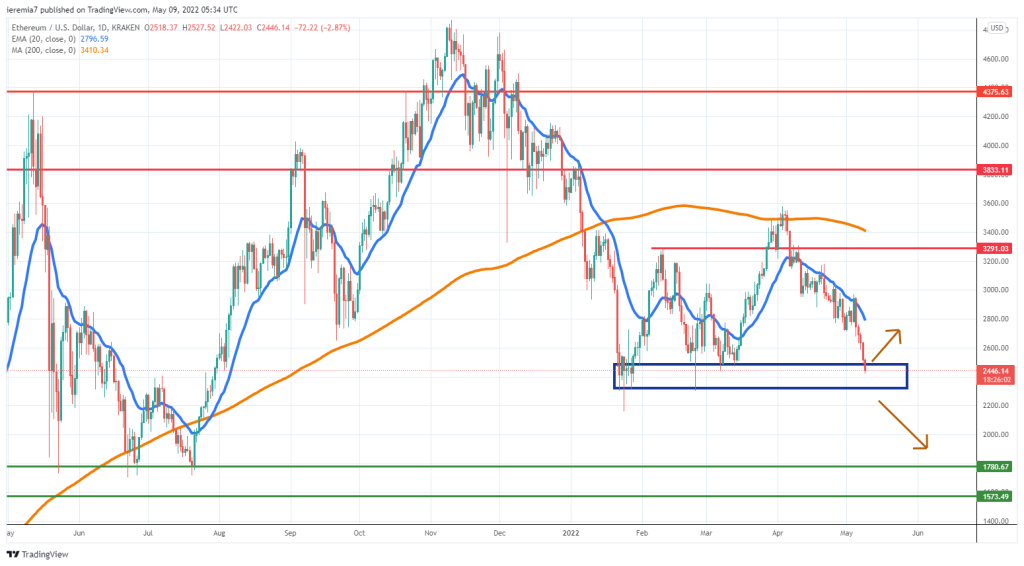
ETHUSD (Kraken)
Source: TradingView
This selloff is not contained in Bitcoin but has spread to the wider public. We can see the same price action on the daily chart when it comes to Ether as well. 4 consecutive days of impulsive selling are not encouraging for the near-term and given the price has also entered out key support area mentioned last week, failure to generate a bounce right here will be a sign for more trouble ahead.
Although Ether is still around 10% above the 2022 lows, the probabilities are tilted in favor of a continuous slow grind lower. Below the blue area on the chart, $2,200 is the support to watch. However, we believe in the mid-term Ether could weaken further and not find strong support until $1,700.
That’s where a bull run, that last for half a year, has started, so buyers might be incentivized to get long, while sellers can take some profits off the table.
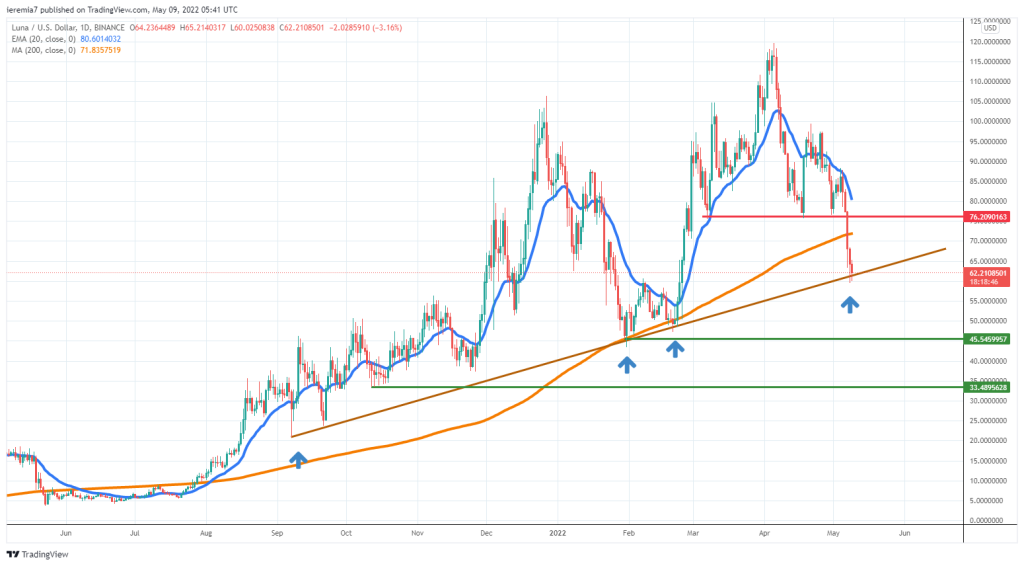
LUNAUSD (TradingView)
Source: TradingView
Down almost 25% over the past 7 days, LUNA is now at a crossroads, since buyers are struggling to keep the price above an ascending trend line that has been respected all the way back to September 2021.
A breakout below the line will be a major hit for buyers and in that scenario, we suspect the price can weaken towards $45 or even $33 in the not-too-distant future. The technical conditions have deteriorated and even if a bounce occurs, sellers might be inclined to sell on rallies, given how strong the dip has been so far.
The price is now below the daily 200 SMA so as long as that line is treated as resistance, there’s more potential selling ahead. Above the MA, watch how the market responds to $76. That is another resistance and a place where we believe sellers could rejoin the trend. This week is not starting with the right foot for LUNA and the broad crypto market, as well.


There are no comments at the moment, do you want to add one?
Write a comment