
BTCUSD (Coinbase)
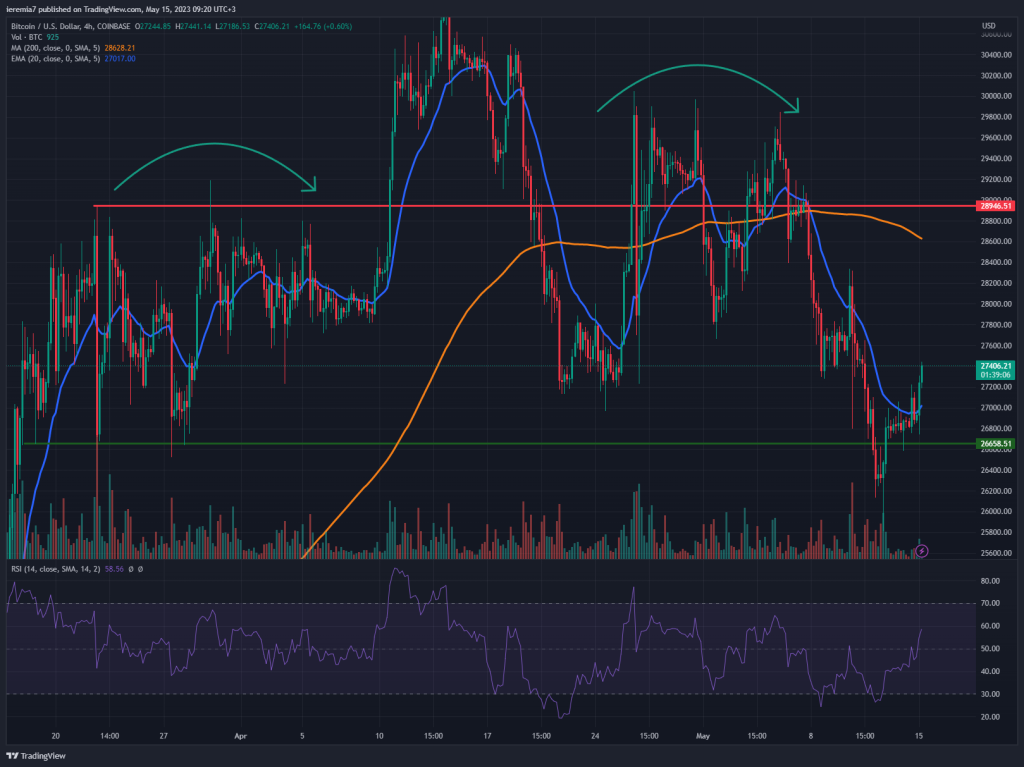
Bitcoin is currently showing some signs of recovery to start the new week, yet when analyzing the broader picture, it looks more like a topping formation. More specifically, we suspect this could be a head and shoulders pattern and as long as the price trades below $30k, this setup will continue to be valid.
The neckline is located around $26.5k, so any meaningful break below it should be followed by heavy selling. Thus far, buyers have managed to cap the downside, and we see BTC trading above the neckline again. Looking at the 4h chart, the price broke above the 20 EMA and the RSI is heading towards overbought levels. It’s a tricky position to get long, which is why advise caution at this point.
Further gains could push Bitcoin toward the $28k resistance area. On the flip side, a break below $26.5k will imply a quick retest of the $25k support. May is not a good month for risk assets and we should couple that with the impressive rally Bitcoin posted this year.
ETHUSD (Kraken)
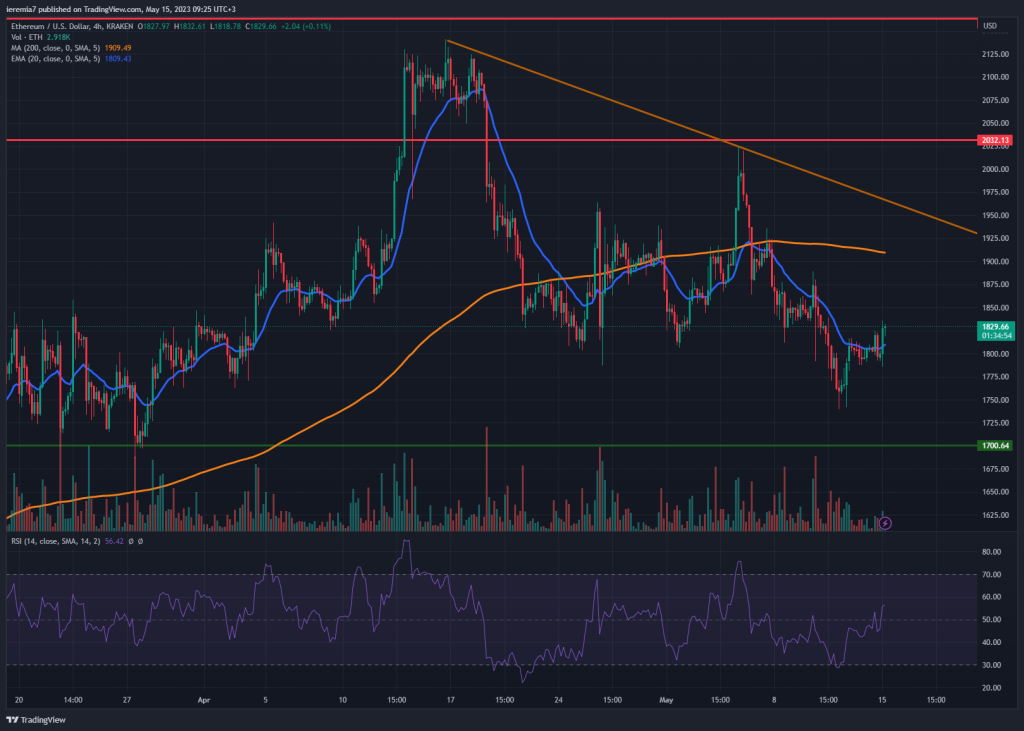
Ether does not look better, considering the lower lows and lower highs. The buyers attempted a rebound, yet we see sellers managed to wipe out all gains. Such developments do not favor bulls, which is why we suspect the price should continue to be under pressure.
Sellers should sell the rips, so the first area to watch for tactical shorts is located near $1,900, where the 200 SMA is also located on the 4h chart. Moreover, we now have a bearish trendline little above that zone, meaning it could be enough to cap bullish momentum.
When discussing support zones, we believe $1,700 is where buyers can get more active. A strong breakout below that will imply a retest of $1,500 in the mid-term. We are short-term bearish as long as ETH trades below $2,000. Only a daily close above that zone could shift our sentiment.
LDOUSDT (Binance)
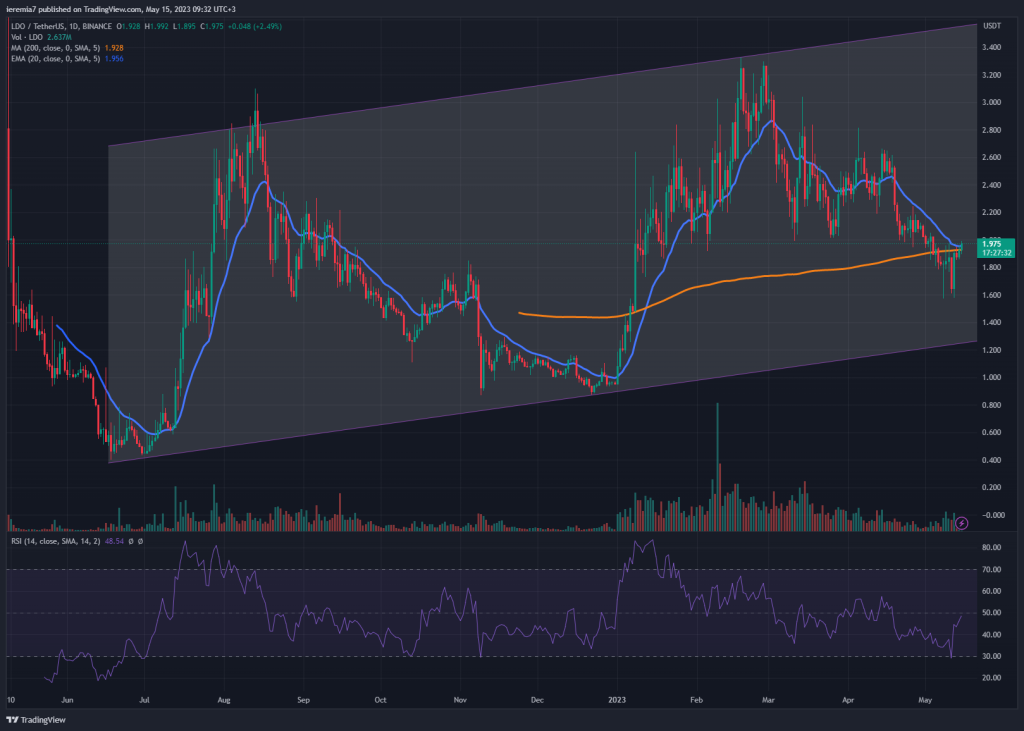
Lido DAO is a cryptocurrency that continues to be in a structural uptrend, communicated by the ascending channel visible on the chart. This coin is up 14% during the last week, managing to outperform the broader market by a large.
On the daily chart, we can see buyers bought the dip below the 200 SMA and now the price is threatening to break higher. If it does and manages to hold above the 20 EMA as well, we might be witnessing the start of a new leg up that could drive the price toward $3.4.
However, buyers should be cautious, since the price did not retest the channel’s lower bound. We believe there is still scope for some selling if the broad market weakens and that will imply a better buying opportunity could emerge around the $1.3 area.
Compared to other larger names, LDO has a higher probability to outperform if the bullish sentiment resumes across the entire market. Buyers will be incentivized to look for coins that are in a good technical position, which is the case with LDO.


There are no comments at the moment, do you want to add one?
Write a comment