BTCUSD (Coinbase)

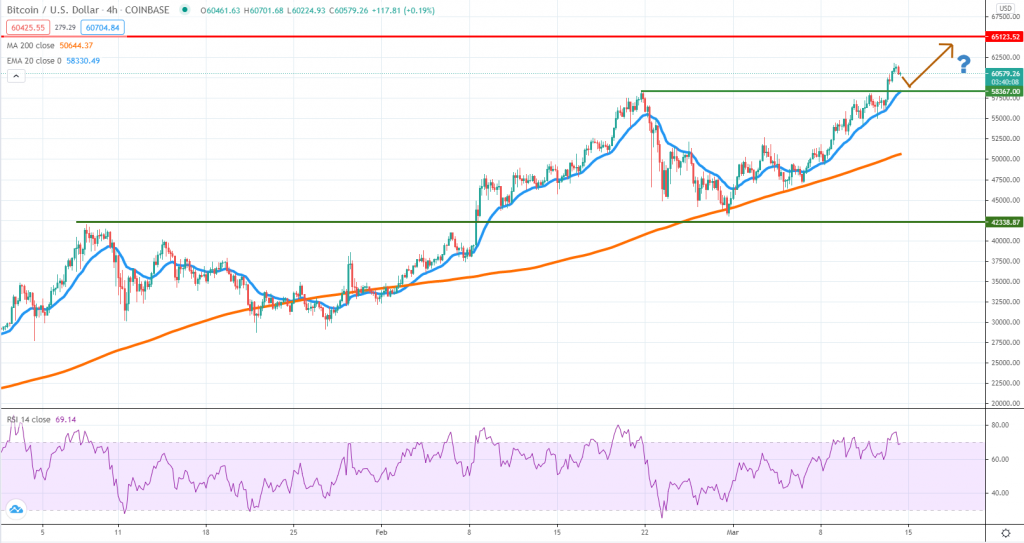
After continuing the recovery during the week, Bitcoin managed to break above the prior all-time and now is trading above $60,000 for the first time in history. Based on prior similar occasions, a breakout above new ATHs had been followed by sustained buying, which is why it is very likely the price will continue to edge higher in the following days.
However, we should not exclude a retest of the $58,300 level and only then renewed buying pressure that could lead the price towards the $65,000 key psychological area. At the same time, there could be more upside potential, but the key FED meeting on Wednesday might be a game-changer for USD.
That means if the dollar starts to go higher, that could weigh on BTC’s momentum. Breaking below $58,300 impulsively will be the first sign of bearish strength. The 4h chart 200 SMA had been capping the downside this year so that’s where we should see buyers rejoin impulsively. RSI trading close to overbought is another factor to focus on.
ETHUSD (Kraken)

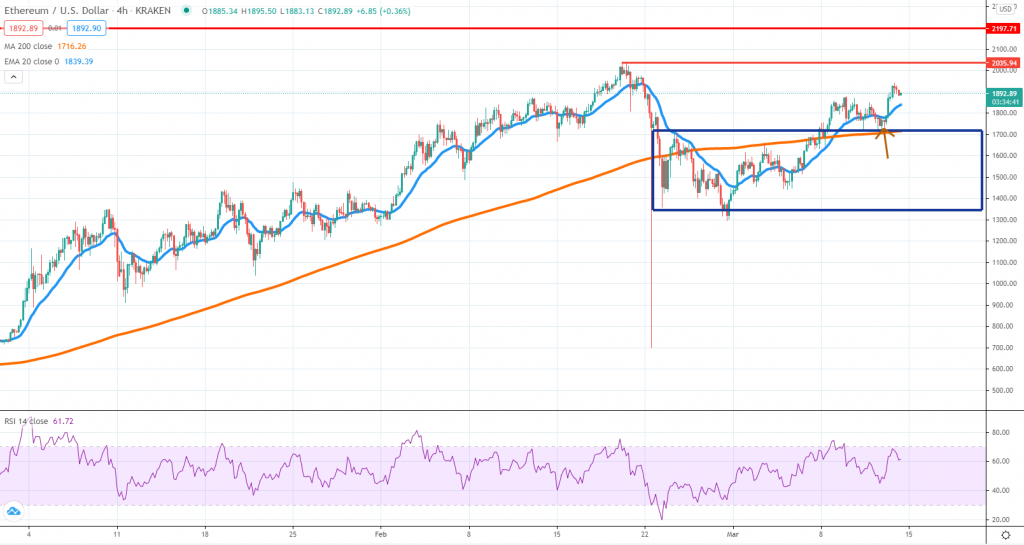
Ether had been lagging behind Bitcoin since it did not manage to break to new all-time highs. However, buyers did manage to push the price above the range we’ve highlighted last week and that could transpire into more pressure around the $2,000 area in the following days. For now, the market seems rather calm, pointing upwards while still trading above the 4h chart 20 EMA.
Only a breakout above the currently ATH will be a clear signal for a continuation higher and until then, Ether remains vulnerable to significant selling. In case bears will resume in force, that could mean a lower higher and a potential A-B-C type corrective move, that could drive the price back inside the range.
If the ATH will be broken, we suspect $2,200 will follow as resistance. In the opposite scenario, in which sellers regain control before buyers push the price to new ATHs, the prospects are poorer, since the price could dive towards $1,300 again.
XRPUSD (Kraken)

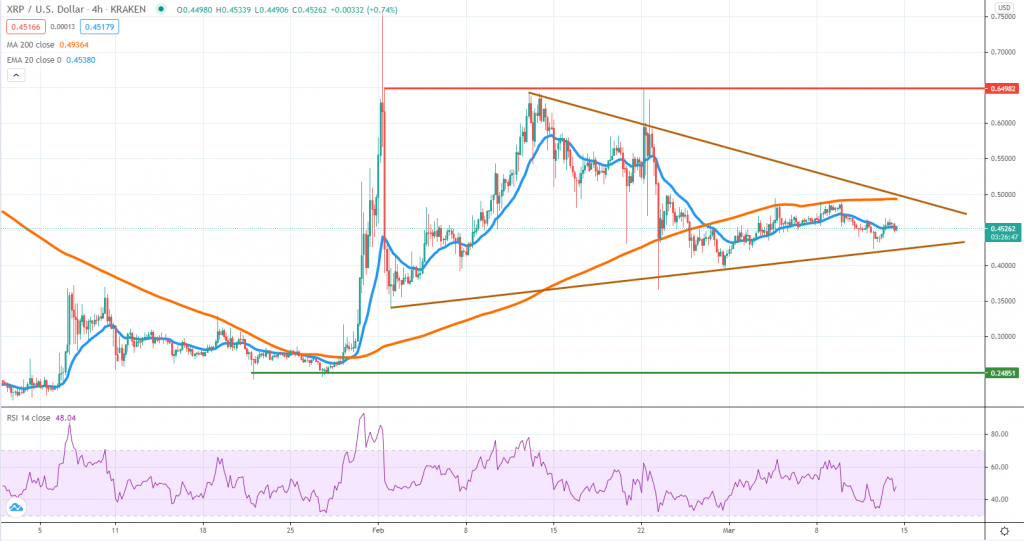
Although we’ve seen several large swings in XRP since the end of January towards the end of February, the volatility had dropped substantially and the price is now being compressed inside a triangle-type formation. The structure had almost been filled and now the breakout looks imminent.
It could occur on either side, but the good news is that following, we should have more direction bias. A break on the upside could unlock renewed buying momentum that could lead the price towards the 65 cents key resistance area.
On the other hand, if sellers gain control and push the price below the triangle, there could be more losses down the road, potentially leading XRP back to the 25 cents support, where the end-January rally had begun. We believe buyers have a slight advantage in winning this battle, but until the breakout will occur, it would be better to stay put and wait for further clues.


There are no comments at the moment, do you want to add one?
Write a comment