
Bitcoin
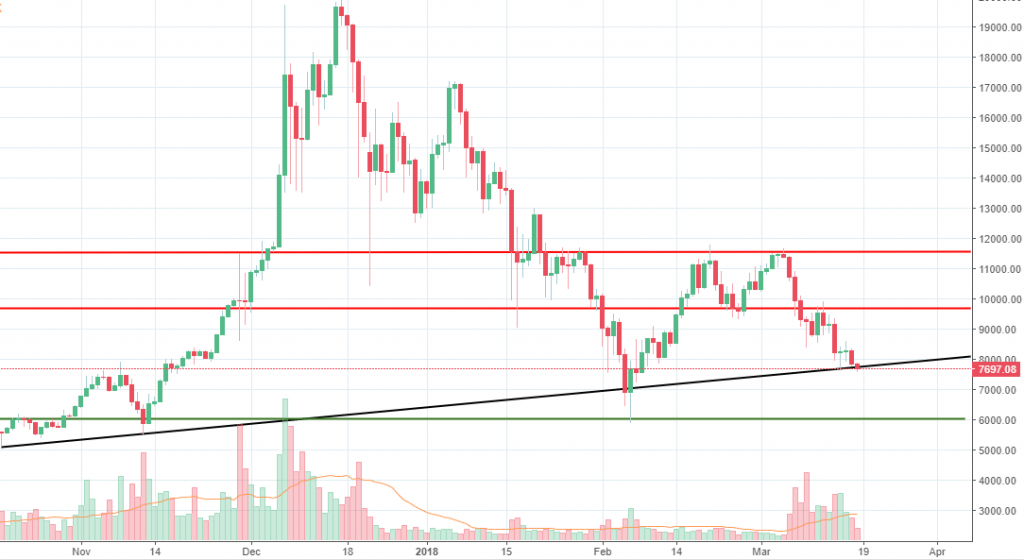
Since our last weekly analysis, the Bitcoin price had continued to be under pressure and we have managed to anticipate the move, as well. We’ve mentioned that is very likely the bearish leg will continue to extend and that is exactly what happened.
However, as you can see from our chart below, the price action is now around an ascending trend line, confirmed by three points. On Thursday we can see there had been some interest to buy, but all gains had been erased. A daily close well below the trend line, followed by weak buying interest will confirm the move will most likely continue towards 6,000 where the 2018 low is located.
On the other hand, if buyers will manage to rebound around the trend line, we could see a new leg up emerging and heading towards 9600, where sellers resumed at the beginning of this week. Above we have the 11,500 key resistance area, which had been mentioned several times in the last few weeks.
Source: dailyfx.com
Ripple
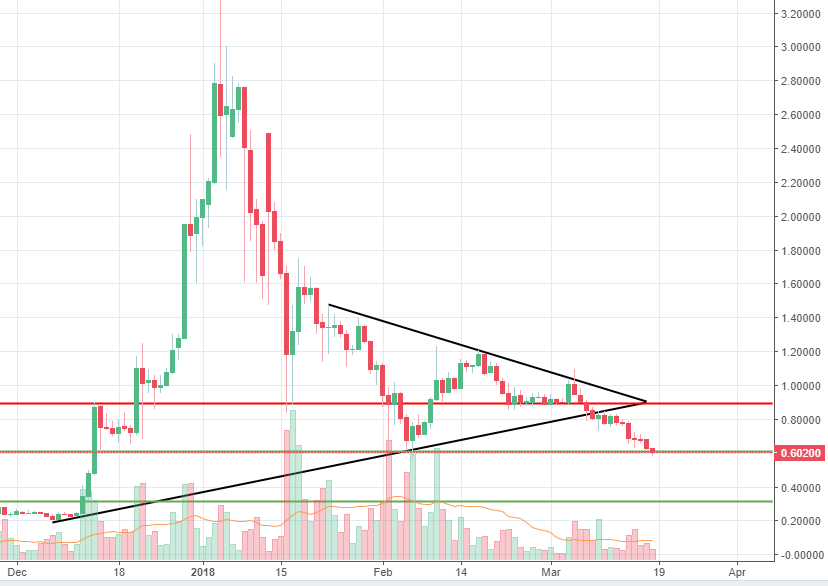
Ripple is another cryptocurrency that continued to slide for the last week. The price action continued to head lower, following the downside breakout of the triangle formation. At the time of writing, the price is right at the 2018 low, 0.60 area, which had been mentioned several times by us as a key support area. We can see buying interest emerging in the past, but this time the situation looks different.
Sellers are continuing to be active and buyers do not show any sign. A breakout below that support will open more room towards the 0.30 area.
On the other hand, if 0.60 will turn out to be a strong support and buyers will emerge impulsively, a new bullish leg might emerge and drive the price action towards 0.88 resistance zone.
Source: dailyfx.com
Monero
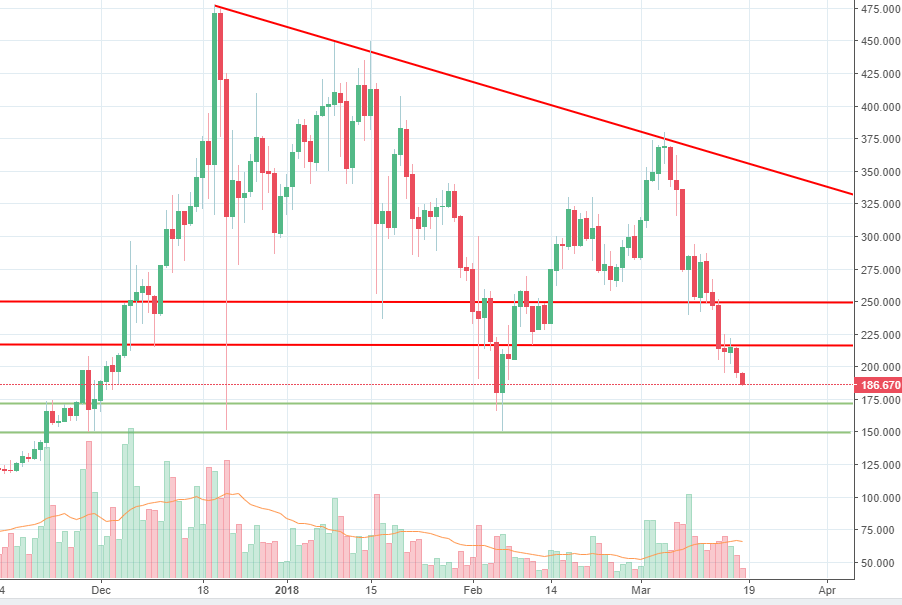
We’ve included Monero in our weekly analysis two weeks ago and at that time the price action was approaching a descending trend line which is also visible on the chart below. We’ve mentioned at that time it was a critical resistance level and sellers could resume there. As you can see from our chart, the selling wave that followed covers huge ground. The price action peaked out at 379 and it is currently located at 186, which means the cryptocurrency lost 50% of its value in just two weeks.
Looking ahead, we expect the price action to continue to edge lower. The 172 and 150 levels are expected to form together a strong support area. However, as the price action is currently unfolding anything can happen, even a downside break.
On the other hand, if the price rebounds higher, 215 and 250 could be areas where sellers might want to resume selling.
Source: dailyfx.com


There are no comments at the moment, do you want to add one?
Write a comment