
BTCUSD (Coinbase)
Source: TradingView
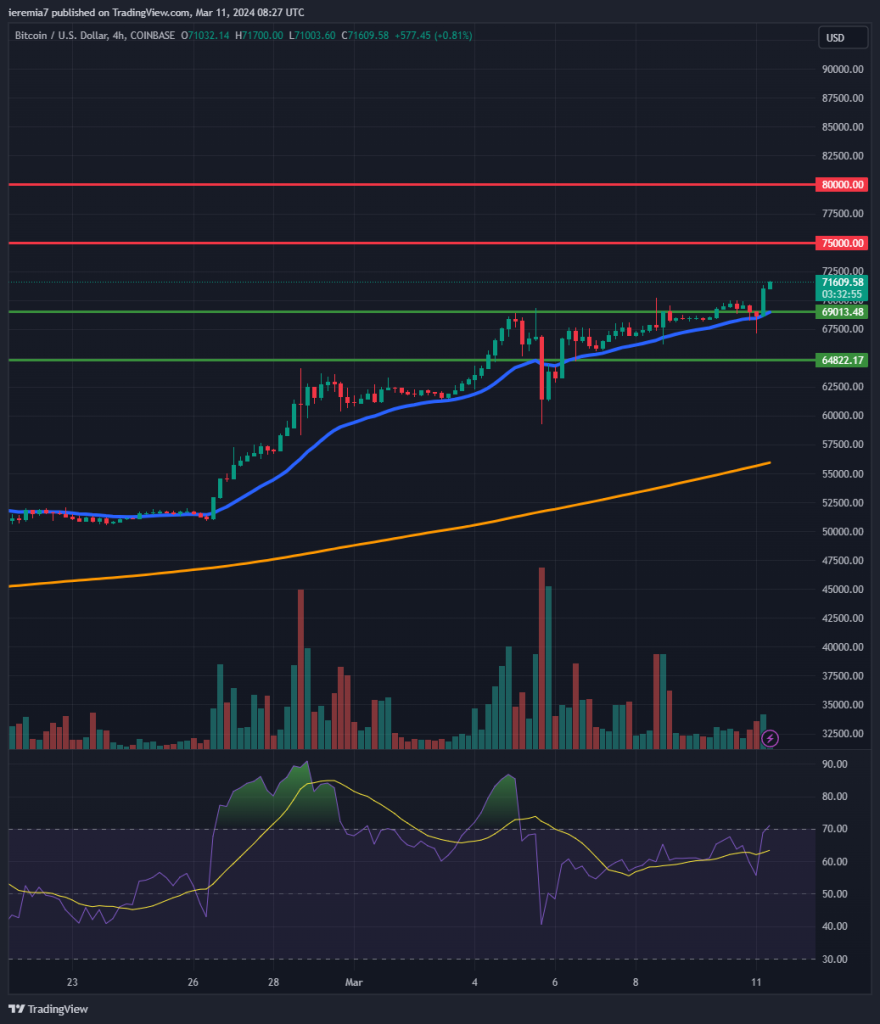
Bitcoin is officially trading at an all-time high, after managing to surpass the $69,000 level reached in November 2021. As we expected last week, $69k acted as a temporary resistance level, but there’s nothing to cap the overwhelming flow of bullish interest.
Looking at the 4 chart, we are seeing a classic pre-breakout squeeze and now that the prior ATH was cleared, BTC is trading little above $71,600, at the time of writing. Finding key resistance levels in uncharted terrain is difficult, which is why we’ll stick with major psychological levels.
The first one to watch is $75,000, where bulls might want to take profits off the table and shorts could enter strongly, expecting a pullback after the impressive run higher. If the market breaks above that as well, $80,000 should be a stronger resistance level.
On the downside, we remain bullish as long as the price does not break impulsively below $69,000. That will be the early sign of weakness. If it happens, the next target would be $65,000. Watch the price action structure and notice if the market will start treating the 4h chart 20 EMA as resistance, instead of support as is the case now.
ETHUSD (Kraken)
Source: TradingView
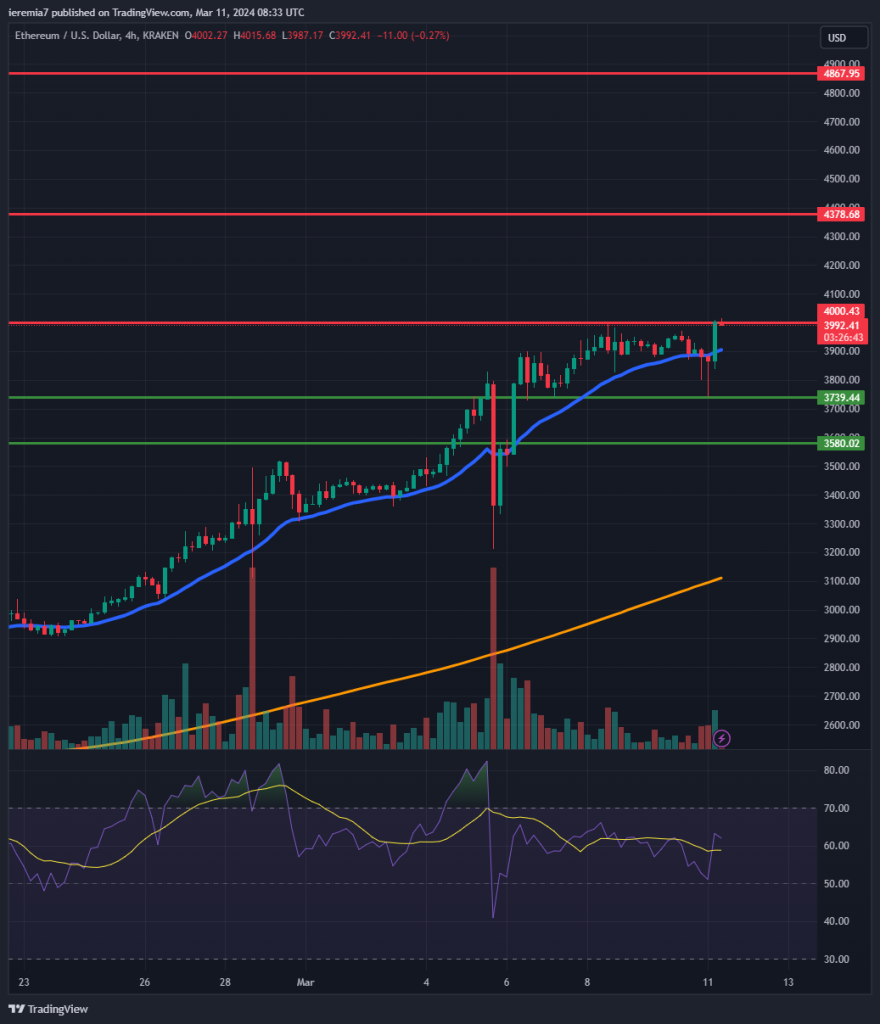
With BTC at an all-time high, the market will probably expect more gains in Ether. Even though the price is not close to the 2021 high, the momentum is strong. At present, buyers seem to encounter mild resistance around $4,000. That is a key level, but the price action structure continues to support further gains.
You can see how each dip below the 20 EMA on the 4h chart is being bought aggressively, meaning bullish momentum remains very strong. With that being said, we believe there is scope for more gains unless major negative news comes out. The next significant resistance is located close to $4,400, so there should be at least a 10% upside potential from here.
On the bearish side, we would get cautious if Ether breaks below $3,700 and $3,580. That could be the early stage of a deeper corrective move. The buyers will get exhausted at some point, so be careful how you case this market higher.
NEARUSD (Binance)
Source: TradingView
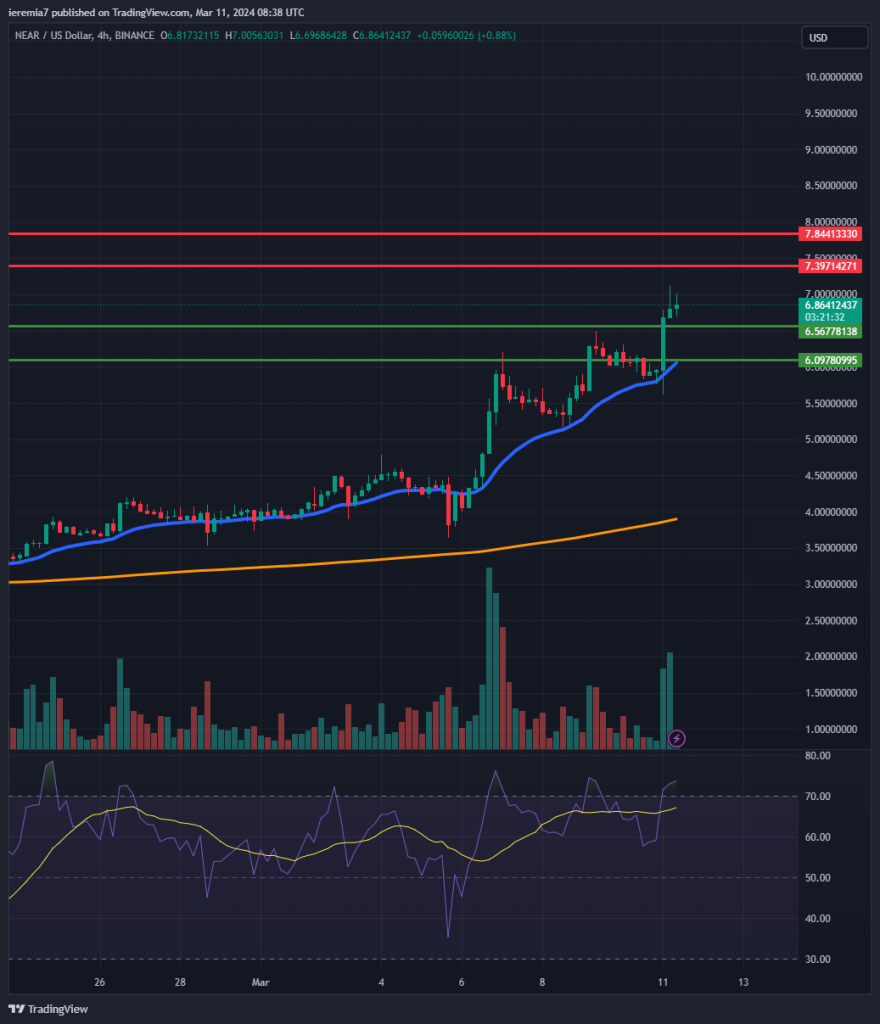
NEAR is up a staggering 50% in one week, and the latest price action developments, point to a major bottoming formation in this coin. Breaking both $6 and $6.5 was the green light and now the market attention shifts towards $7.4 and $7.9. Those are resistance levels you need to watch because if the market breaks and holds above them, the rally could be just getting started.
Shorting at this stage is not optimal, because NEAR can continue to rip higher after every minor dip. Elevated volatility means the market can go either side, so we flagged this coin since traders will continue to monitor it closely, given the robust gains.
The upside will break if NEAR falls below $5.5. That will be the early sign to watch if you want to play the bear case. Also, the relationship with the 20 EMA needs to flip, which is something not yet occurring.


There are no comments at the moment, do you want to add one?
Write a comment