
BTCUSD (Coinbase)
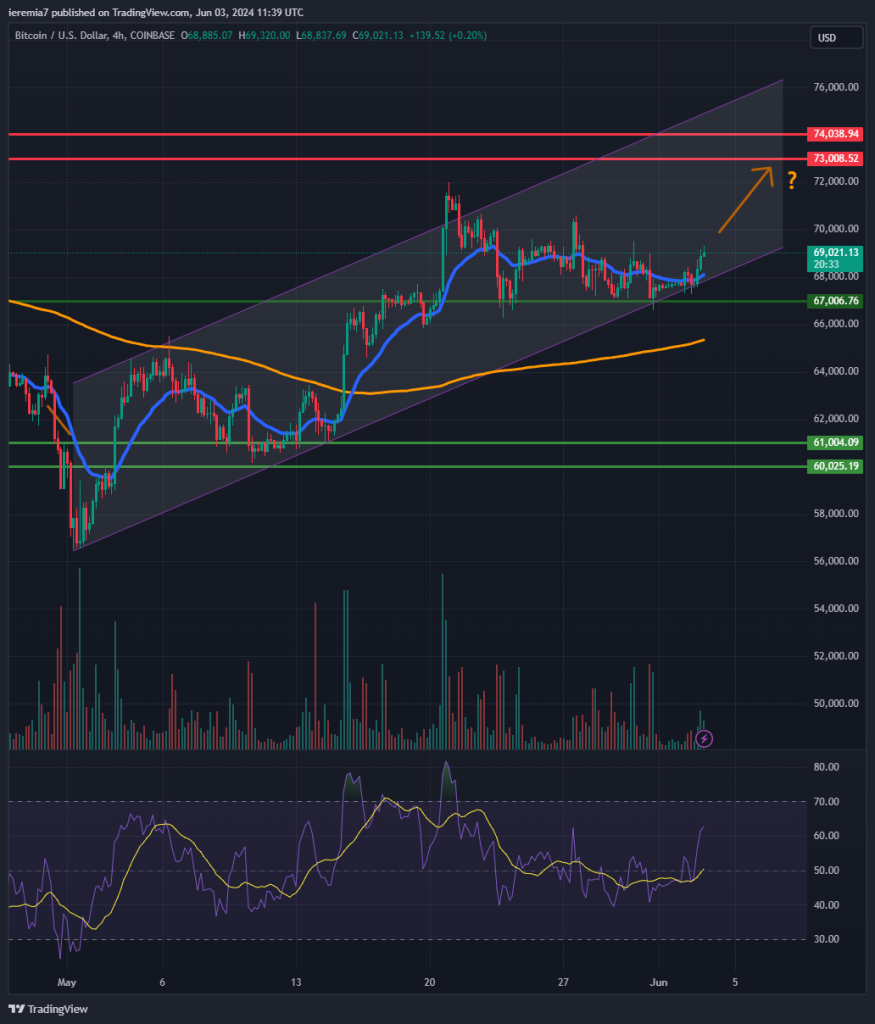
Bitcoin has consolidated lower last week, but losses have been contained. As our chart shows, the $67k area we highlighted capped the downside, alongside the ascending channel. Considering the structure remains in play, we are bullish for this week, as the market has a pocket of calm until next week’s FOMC meeting.
With that being said, we think the market has the potential to rebound and edge toward the $73k – $74k key resistance area. The upper line of the channel is currently located at $76k, so plenty of room for a breakout higher as well.
Keep in mind that it’s just the first trading day of June, so the price action could be choppy until there is an agreement among market participants concerning the next direction of price. As a result, if BTC breaks below $67k, the 200 SMA on the 4h chart should be watched. Below that, we think the market will weaken towards the $60k area, which held as support several times so far.
ETHUSD (Kraken)
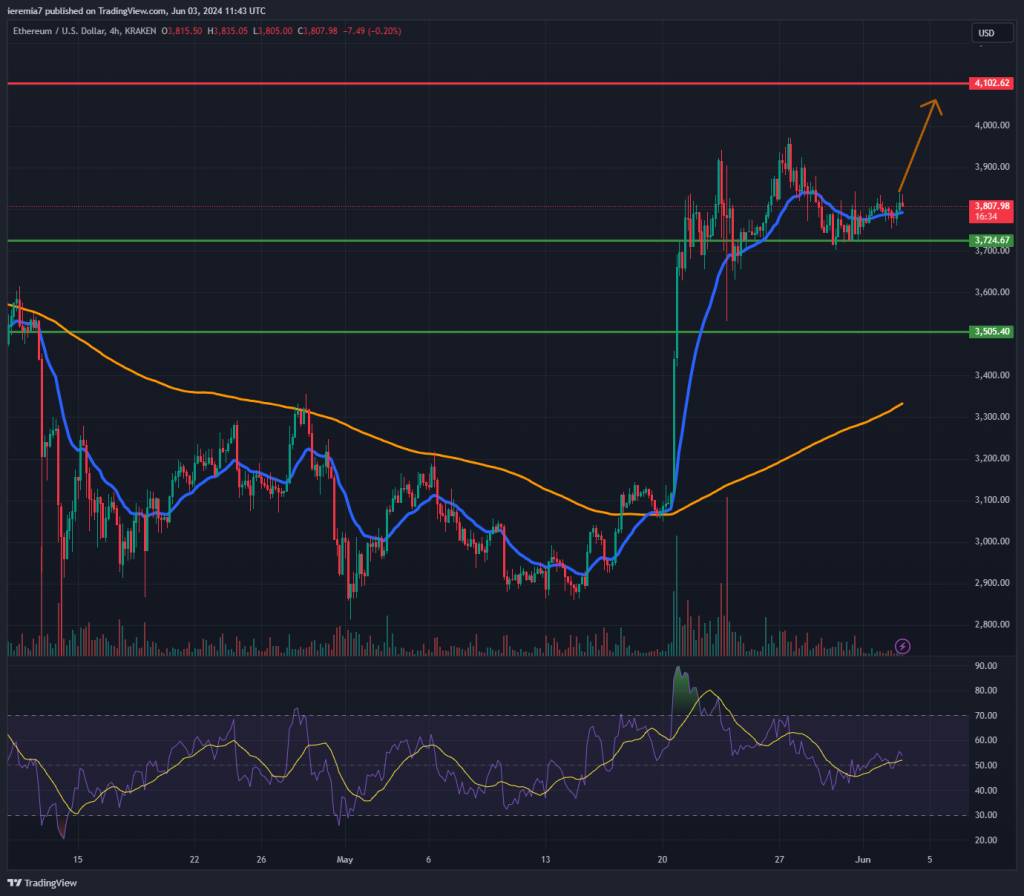
The euphoria surrounding an Ether-based ETF listed in the US cooled down last week, but that doesn’t mean the market is up for a reversal. We still think shorting ETH at this point is not ideal, so the path of least resistance is up.
Looking at the chart, you can see how the $3.7k support capped the downside and now the price action is coiling towards the upside. Momentum has not gathered pace and the RSI is still trading around 50, meaning the price could go either way.
But, as already stated, we think there is scope for renewed bullish momentum and because of that, Ether could edge higher toward $4,100 where it might find some temporary resistance. Conversely, weakening below $3,700 could push the market back closer to $3,500, where we expect the 200 SMA also to cap the downside.
Based on recent history, traders and investors could be energized at any point, in case fresh news about ETFs pops up. One should also not exclude the likelihood of disappointment.
BNBUSD (Binance)
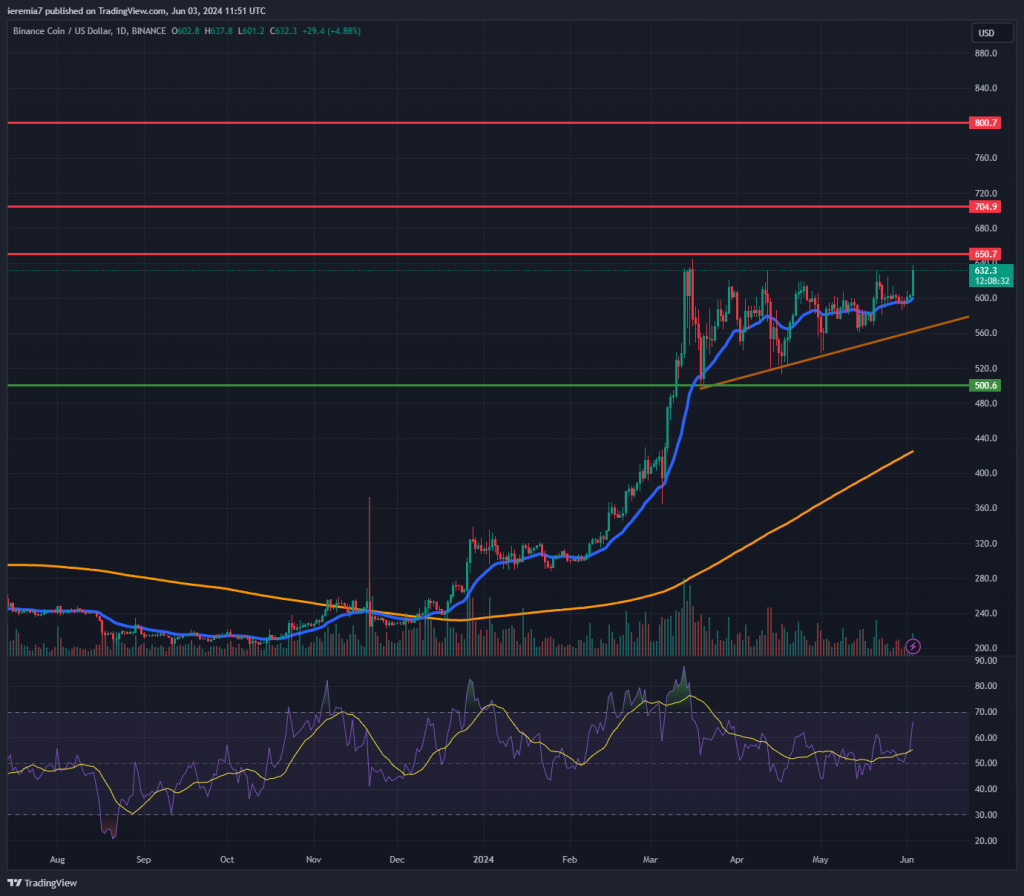
Binance Coin shows no reprieve and continues to get close to prior all-time highs. The daily chart shows an ascending triangle, which is actually a pre-breakout setup that could indicate a pending push on the upside.
You can see how each dip below the daily 20 EMA is being bought. Additionally, there is the ascending trend line that should also cap any potential downside. As long as the highlighted structure remains in play, we think BNB will very likely reach and even exceed the all-time high. The main resistance levels to watch are $650, $705 (all-time high) and then $800.
Most of the time, when the price touches a new high, that triggers a chase, as many traders follow the direction of the breakout. Pullbacks toward the 20 EMA are buying opportunities until a wave of impulsive selling negated the current bullish structure. We favor an extension on the upside this week, barring any negative news linked to Binance.


There are no comments at the moment, do you want to add one?
Write a comment