
BTCUSD (Coinbase)
Source: TradingView
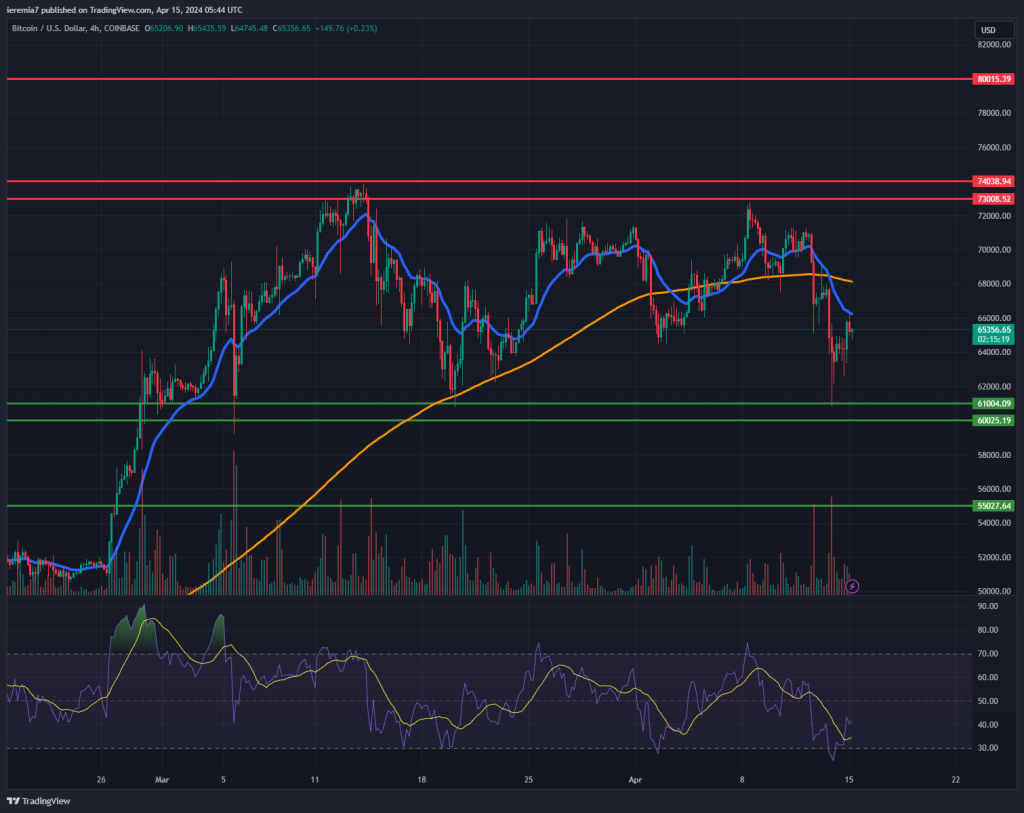
The last few days have been about geopolitics and risk assets took a dive as markets feared a new conflict in the Middle East will emerge. Bitcoin was also under pressure and we can see how the price slumped all the way to that March 20th low around $61k.
Now that the dust has settled and a broader conflict seems less likely, it might be the case to consider once again chasing the upside. Based on our assessment, Bitcoin is now in consolidation mode. The range is formed by $61k – $60k on the bottom and $73k – $74k at the top.
Until a breakout on either side occurs, these will act as support and resistance, respectively. It’s still just Monday morning and not all traders are back at their desks. But, the Asian session has been calm, meaning the market might be gearing for a relief move higher, now that the risk event failed to materialize.
As a result, we favor a move higher and the first hurdle will be the 200 SMA on the 4 chart, sitting around $68k. Once the market clears that, the ATH will be back on the cards again. Conversely, a break below $69k would be our risk-off trigger. In that scenario, we expect Bitcoin to move towards $55k.
ETHUSD (Kraken)
Source: TradingView
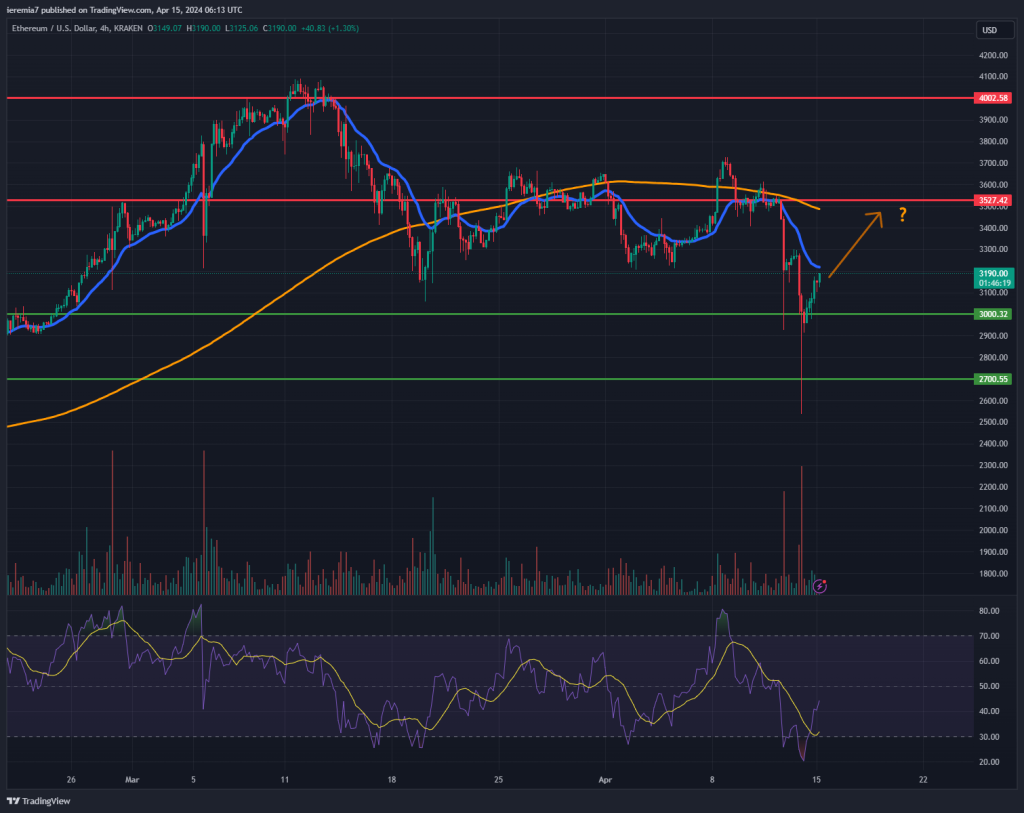
Damage can be easily noticed in Ether as well, which slumped close to $2,500. However, the move looks like exhausted selling, an early sign suggesting the market is about to turn. We view $3,000 acting as support as well, so the path of least resistance looks to be up, not down.
Although ETH is not yet above the 20 EMA and 200 SMA on the 4h chart, the RSI has crossed above the oversold area and momentum is improving. We believe it’s possible to see ETH moving up towards $3,500.
If the market breaks above $3,700 that will show the bull trend has resumed and pressure will mount once again on the $4,000 key resistance area. In this scenario, the likelihood of a breakout above would be high, as sellers will have to fight strong market momentum. The risk-off trigger will happen if ETH moves below $2,700 and fails to bounce impulsively.
BNBUSD (Binance)
Source: TradingView
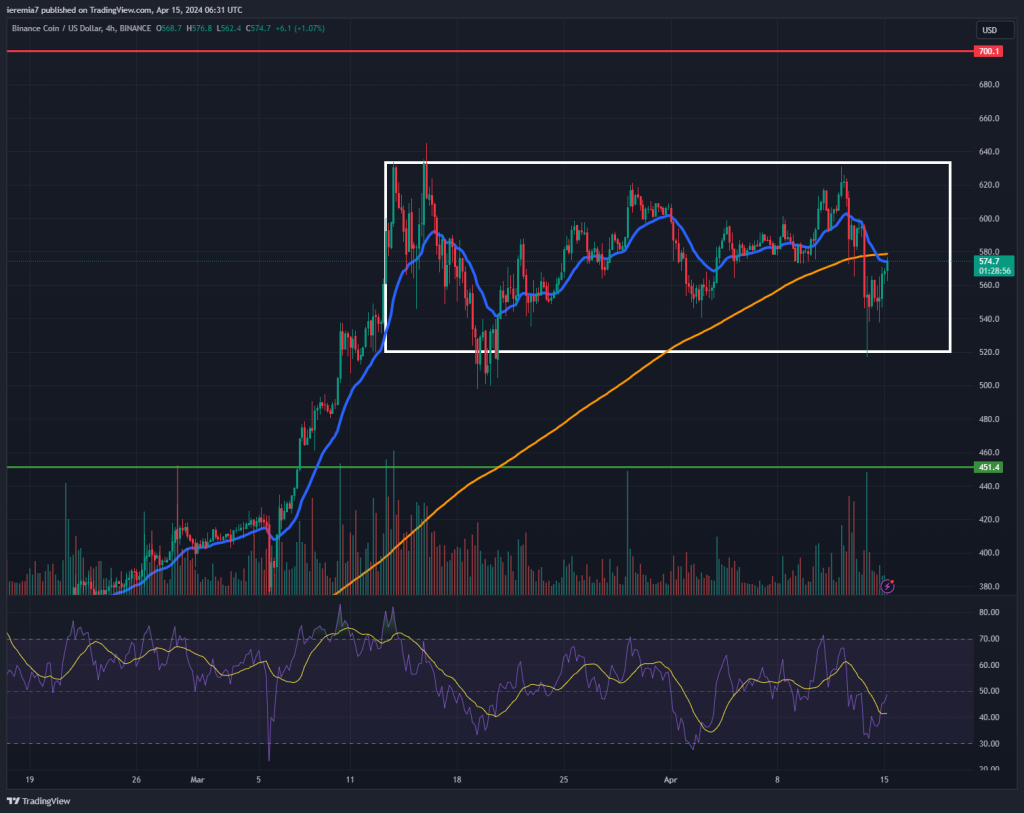
It looks like Binance Coin has not been affected so badly by the broad market selling and we say that because the price failed to break below the March 19th low. This is a sign of optimism since when the market sentiment improves, this coin has a higher probability to outperform.
Technically, BNB did not move well below the 4h chart 200 SMA and in fact, it is now threatening to break back above it. For about a month, this coin has consolidated in between $640 and $520. Until a break on either side occurs, we can’t commit to any direction.
If the market breaks below the range, then our next support comes at $450. On the flip side, a continuation higher a break above $640 will open more room towards $700. We are favoring the upside scenario at this stage, considering BNB managed to hold its gains without major damage.


There are no comments at the moment, do you want to add one?
Write a comment