
BTCUSD (Coinbase)
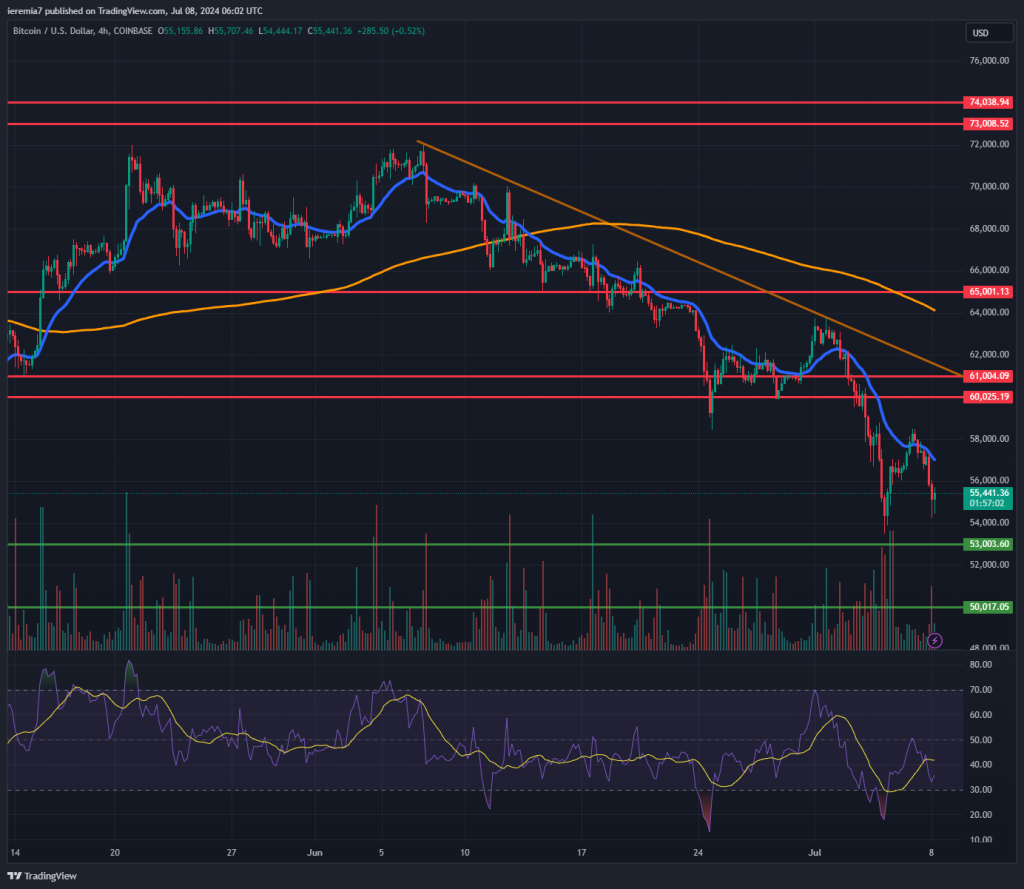
We warned in our last analysis that a break below $60k is a bearish sign for BTC and as that scenario unfolded, follow-through selling pushed the price towards $54k. It seems like the market was frontloading as the hacked exchange Mt. Gox wants to liquidate holdings in order to compensate investors.
Although this led to a sharp drop in the Bitcoin price, we expect the market to recover once the large selling orders are completed. With that being said, $53k is a key support followed by $50k. A bullish shift will occur once the market breaks above the 4h chart 20 EMA.
Only then we shift attention back to the $60k – $61k role reversal level. It should be important to break on the upside since it overlaps with a falling trend line as well. Usually, summer months are quiet in a bull market, so a reversal to the mean has a higher probability of occurring. The post-halving period is bullish from a historical standpoint, which has not happened so far this year.
ETHUSD (Kraken)
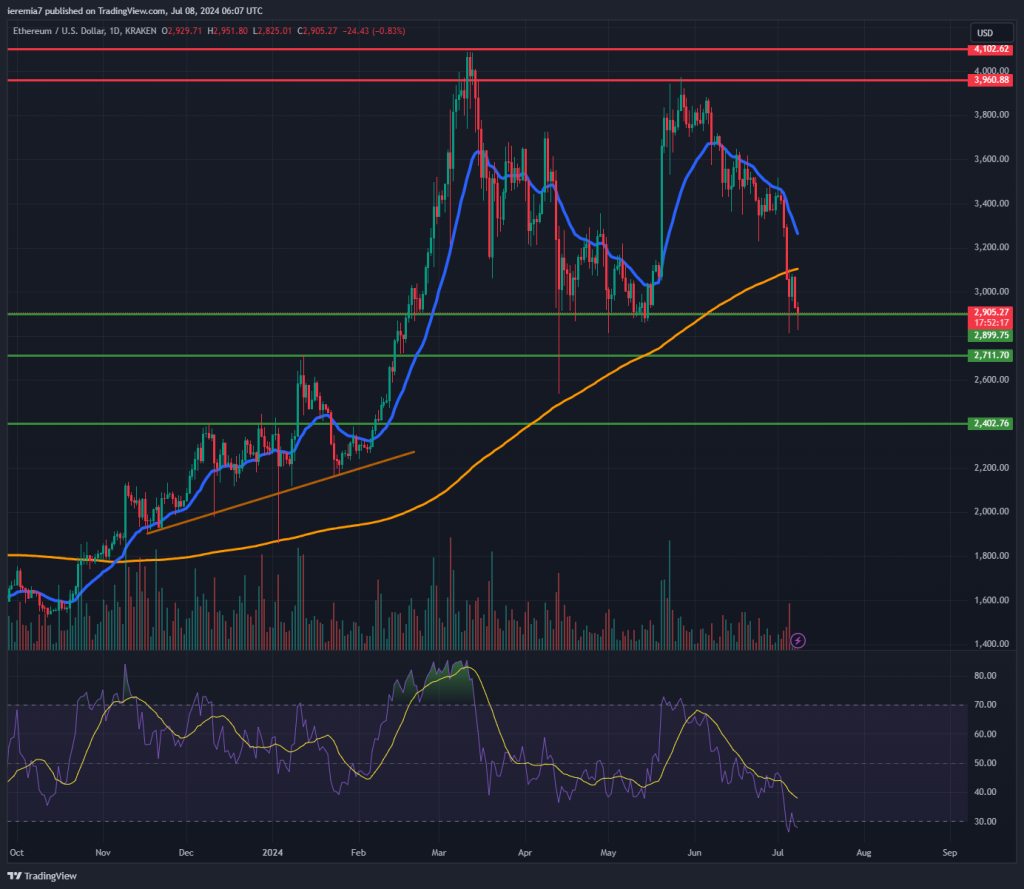
Once again we see how important the Bitcoin’s performance is for the broader market. Ether sold off impulsively as well and now the price is hovering close to a key support area. We think there should be interest close to $2.9k and $2.7k. If not, the market could slump further towards $2.4k.
Ether is now trading in an area where it bottomed and rallied higher back in May. If the support zone holds, traders can expect a rebound. We should also highlight that despite a very positive performance seen in tech stocks, the crypto failed to follow suit.
The correlation is not always close, but it’s worth mentioning the divergence. If stocks start to weaken or consolidate, capital could flow back into crypto, as valuations are more affordable. But first, we need to see Ether breaking back above the daily 200 SMA. The RSI also sold off to oversold conditions, so there is fuel for a bounce at this stage.
BNBUSD (Binance)
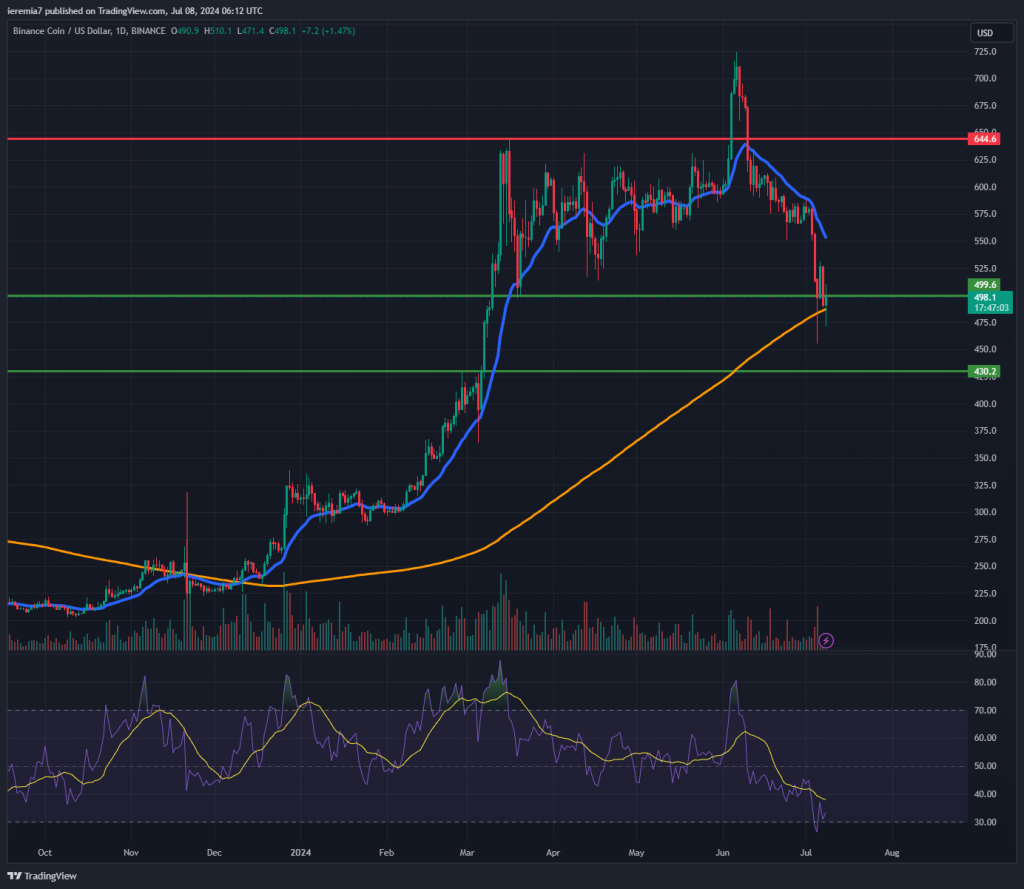
Crypto liquidations are not positive for exchanges either, which is why there should be no surprise to see Binance Coin posting double-digit losses last week. However, the price is not at a potential inflection point, since the $497 level + the daily 200 SMA are expected to act as solid support.
Rightfully so, the price dipped below the zone but failed to drop further, suggesting buyers have leveled off the playing field. Bottoming could take some time, but we expect a recovery to start in the upcoming days.
We have new inflation prints from the US to be published this week and if things are within the range of expectations, that can fuel a new wave of risk appetite. Inflation worries have eased and combined with a weaker US Dollar, coins like BNB have room on the upside.
The resistance level to watch is $644, which is also a swing point on the chart. Above that, the current high for the year at $725 will come under heavy pressure.


There are no comments at the moment, do you want to add one?
Write a comment