
BTCUSD (Coinbase)
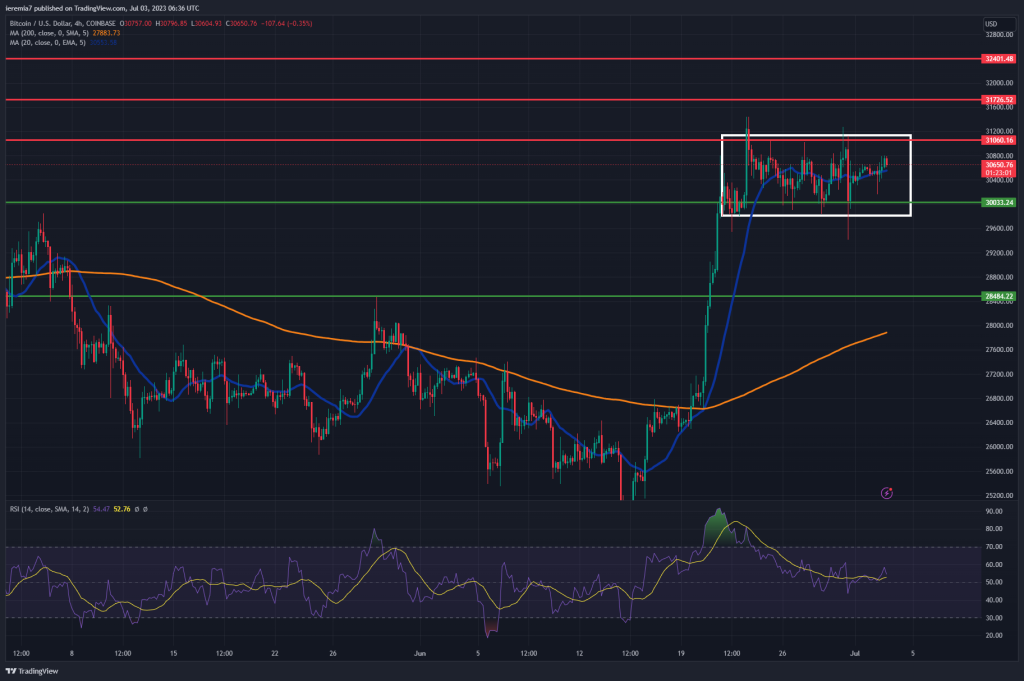
After reaching a new high for the year, Bitcoin consolidated in a pretty narrow range, still trading above $30,000. Although the rally did not extend any further, the uptrend continues to be intact and the current consolidation serves as a foundation for another leg higher.
The price is consolidating between $31,000 and $30,000, which means directional traders should wait for a breakout on either side. If the price breaks on the upside, we treat $31,700 and $32,400 as the next targets to watch.
Playing the downside is a bit trickier, considering buyers might want to take advantage of false breakouts below $30,000. If selling does intensify, we expect support around $28,400 and the 4h chart 200 SMA. The RSI already retreated from overbought levels, which is why we continue to favor the upside.
We are just starting the second half of the year after Bitcoin posted impressive returns during H1. While favorable sentiment could act as a tailwind, traders should remain cautious, since we are far from the conditions we’ve had in 2020 and 2021, speaking of financial conditions.
ETHUSD (Kraken)
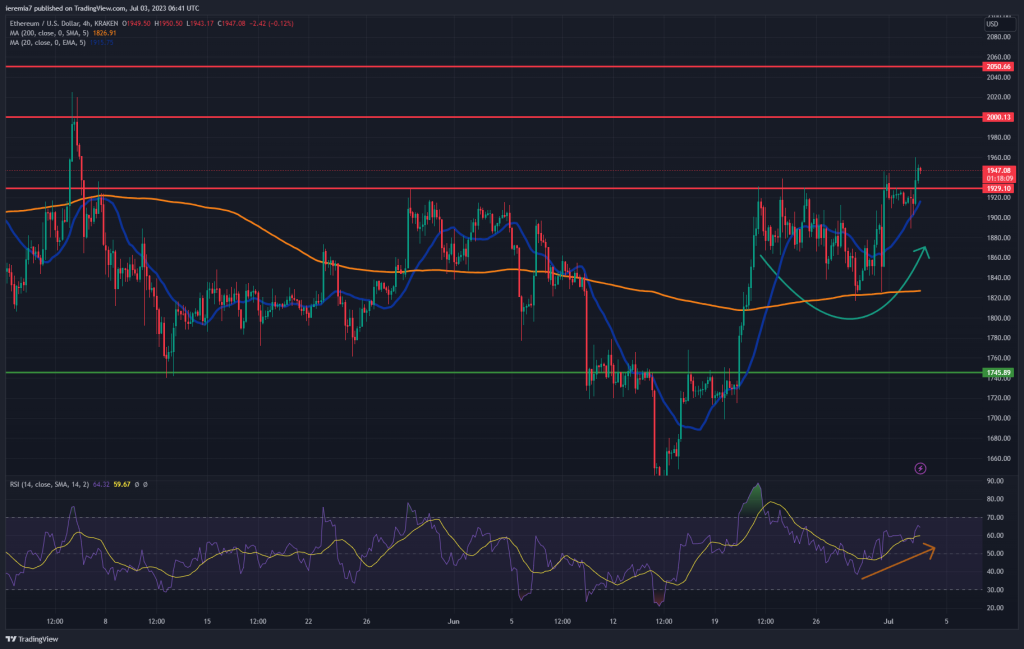
Ether seems to be in a slightly better position compared to BTC, given the price is already signs of strength. ETH had been consolidating below $1,930 for several days, but now buyers are breaking on the upside, which means retesting the $2,000 – $2,050 resistance area becomes the next likely scenario.
The price trades above the 4h chart 20 EMA, RSI is already pointing upwards while below the overbought zone, and we see higher lows and higher highs on smaller time frames. All of these hints are favorable to buyers until an impulsive selling changes the picture.
While we strongly believe Ether could continue its run-up this week, traders should be aware of downside risks. If the price breaks and holds below the 20 EMA, that will be the first sign of weakness. We could see a retest of the 200 SMA, in that scenario, and $1,750 will follow next as a strong support.
LTCUSD (Coinbase)
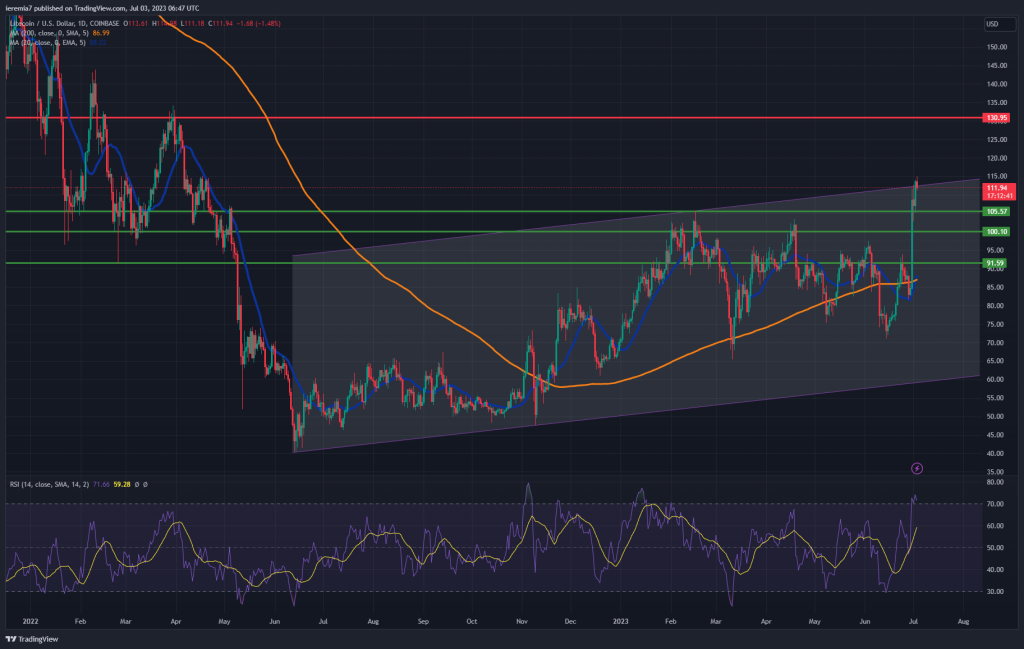
In the absence of major BTC movements, some altcoins are seen dominating. Litecoin is a good example, considering it managed to jump 28% during the last 7 days. On the daily charts, the price action shows a large bottoming formation.
We view $105, $100 and $92 as key support levels, in case the price starts to pull back. Also, LTC is trading inside an ascending channel, which is a good sign in the longer run. If the move up continues to extend, we’ll treat $130 as an important level of resistance.
Also, the price is now struggling to break outside the channel and there could be heavy resistance around current levels. Traders could expect a pullback at this stage, mainly because we’ve already had impressive returns in such a short period. Still, the fact that we are trading above the daily 200 SMA is a strong hint of who’s leading the order flow. Buyers are in control until we see a meaningful break below $85.


There are no comments at the moment, do you want to add one?
Write a comment