
BTCUSD (Coinbase)
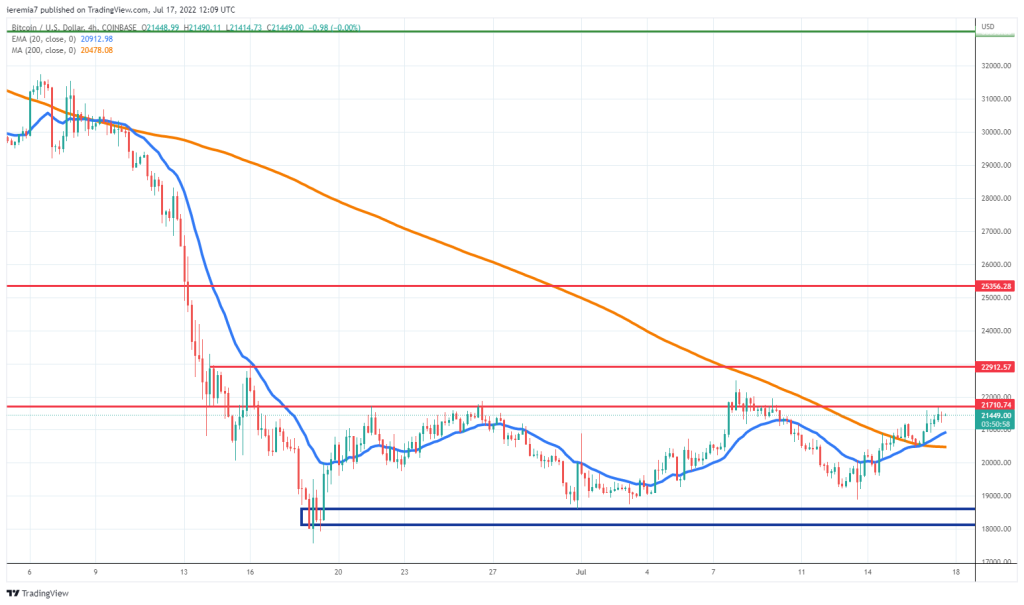
Bitcoin continued to trade sideways during the past week and $21.7k turned out to be strong resistance for buyers. Still, the price did not make a new lower low, below the June 30th swing point, which means, the bulls have a slightly higher advantage.
We are now waiting for a break above the first red line on the chart to occur. If that happens, $23k and $25k will be the next potential targets. From a technical perspective, it will be a major improvement, showing buyers are willing to enter at higher levels.
BTC is now trading above the 20 EMA and 200 SMA on the 4h chart, so the only barrier left in front of more buyers pouring in is the $21.7 area. As things stand right now, we should see more gains next week, even if Bitcoin seems to be underperforming other peers such as Ether.
You should also watch what happens with tech stocks, as we are now seeing some signs of stabilization in that market. If the US Dollar does not continue to strengthen at the same pace it will also be a piece of positive news for risk assets such as Bitcoin.
ETHUSD (Kraken)
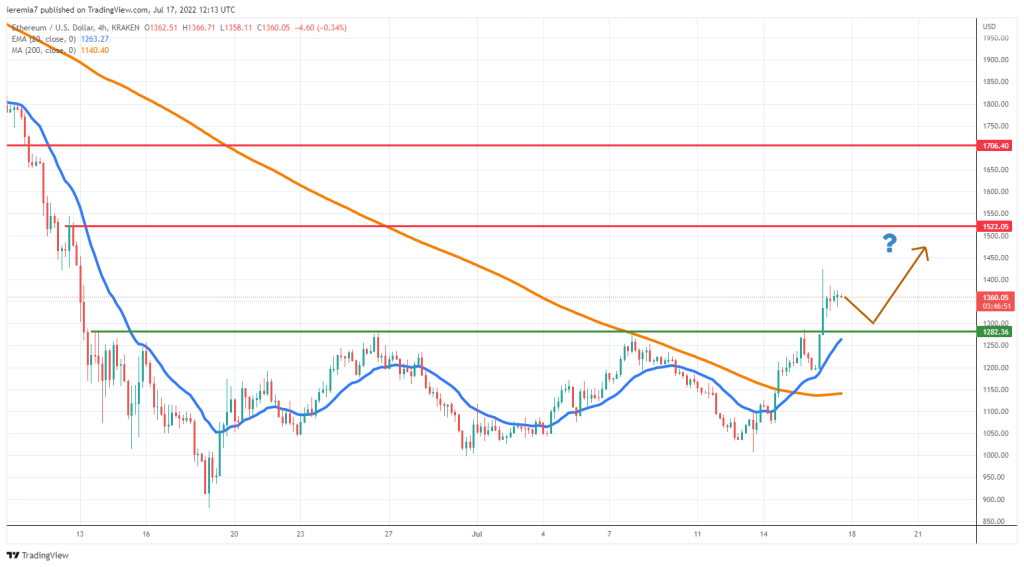
Compared to Bitcoin, the Ether price action looks a lot better. First of all, this token broke above the major resistance at $1.3k and now that area should act as support in case the price will dip lower.
Buyers could be waiting for a pullback towards the broken line and also the 4h chart 20 EMA. We also believe that’s where a new leg up could start, pushing ETH towards the $1.5 area. Technicals have improved and that bodes well for sentiment in the short term.
Be aware that this is not the best month for crypto seasonally, so the market remains vulnerable in the face of a sharp selloff. We should see ETH breaking below the 4h chart 200 SMA and the July 13th low to have a confirmation the sellers regained control.
ETCUSD (Kraken)
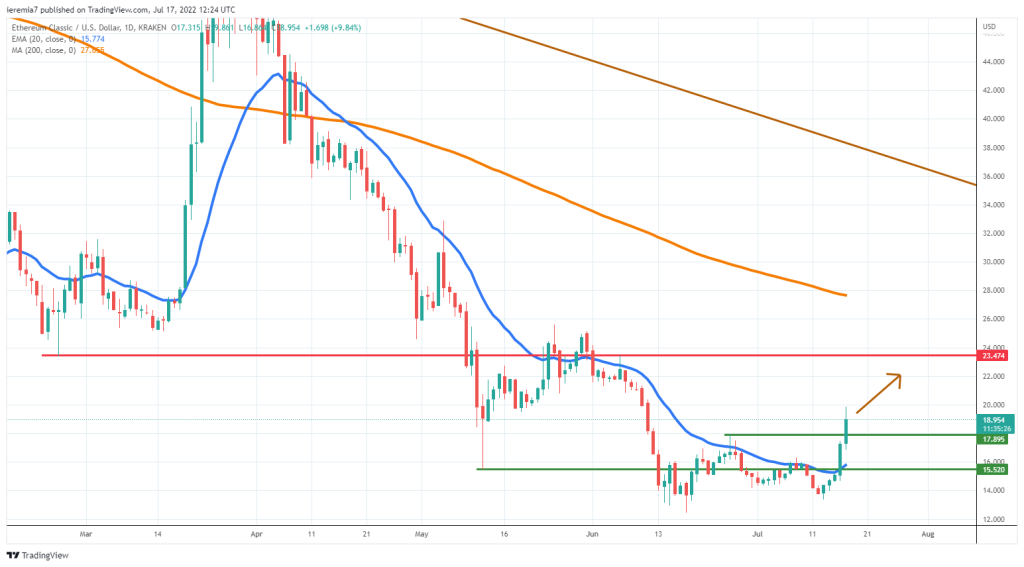
Up 23.5% over the past 7 days, Ethereum Classic is one of the major performers out of the large altcoins. When looking at the daily chart, we can see 5 consecutive days of impulsive buying, suggesting there has been capital pouring into this token.
It’s too early to suggest this is the start of a major run higher, but the early signs are pointing upwards. We suspect ETC can continue to advance towards $23 and then the daily 200 SMA. Same as the broad market, this token has been under heavy selling pressure, but now conditions are changing in favor of buyers.
One of the first signs of a pump-and-dump would be if the price drops impulsively below the daily 20 EMA. In that case, the current 2022 lows might be under pressure again. However, if $18 and $15 will be treated as support, even if some weakness emerges, this will suggest buyers are balancing the order flow and they could start a new leg on the upside.
ETC did not trade above the daily 20 EMA for several consecutive days since the beginning of April, which means this could be the beginning of a larger move higher. The long-term trend remains bearish until the daily 200 SMA will be breached on the upside.


There are no comments at the moment, do you want to add one?
Write a comment