BTCUSD (Coinbase)
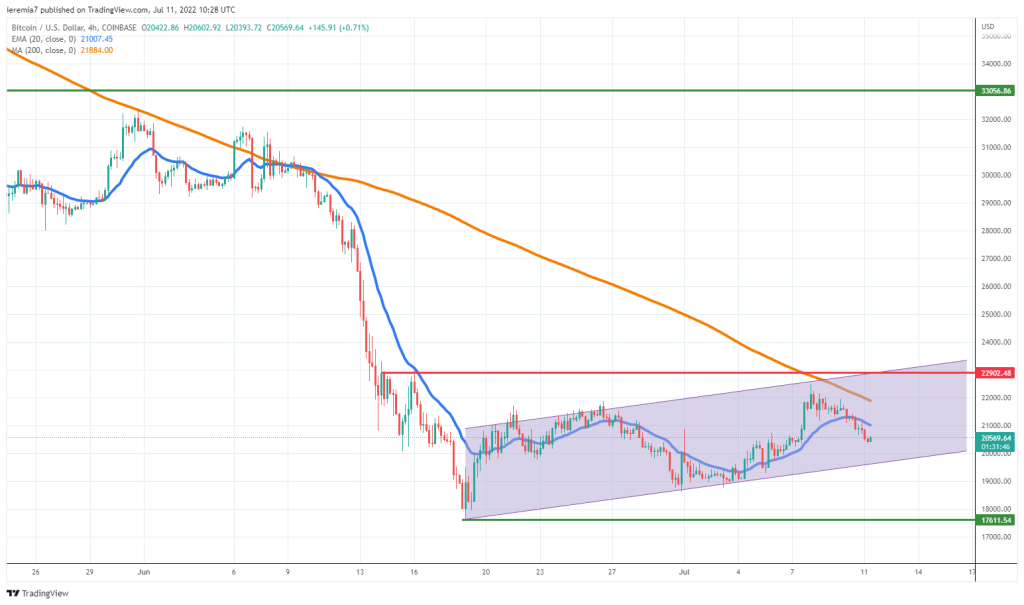
Not a lot of directional bias can be seen in Bitcoin over the past week, suggesting neither buyers nor sellers are willing to step in aggressively. On the positive side, the price broke above the June 26th high around $22k, creating a temporary higher high.
However, gains were not sustained and now we find BTC trading near $20k. Still, the price is developing inside a short-term ascending channel and as long as the structure will be respected by both sides of the market, there is scope for some added gains in the next few days.
Interest rates have been going down, but the US Dollar is going up, suggesting a lack of risk appetite. This week we get new US inflation figures and if the market will get a sense of inflation peaking, crypto, including Bitcoin, might benefit and a bullish impulsive move will be next.
On the other hand, sticky inflation will put downward pressure on risk assets, since central banks will need to tighten even more aggressively. In that case, Bitcoin could revisit lack month’s low around $17.6k. Breaking it will mean $15k is next as support.
ETHUSD (Kraken)
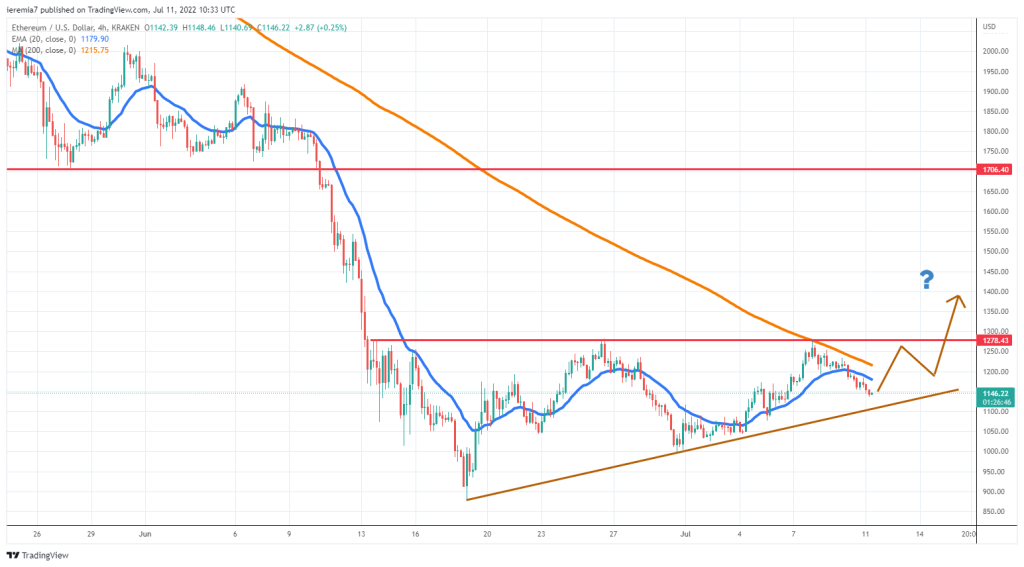
Ether volatility has been compressing, but we can now see the price action inside an ascending triangle. From an order flow perspective, buyers are bidding up the coin and pressure the resistance area around $1.2k. If that breaks, there is a clear path ahead towards $1.5k, a first offer area.
Until that happens, be aware that the price is now trading below the 20 EMA and 200 SMA on the 4h chart. Those are the other two dynamic resistance levels to watch and until a break above occurs, the market continues to be dominated by the sellers.
As long as the price stays inside the tringle, the bullish scenario is likely to occur. On the other hand, breaking the structure lower will be bad news for bulls, since ETH can weaken towards $1k or the June lows.
UNIUSDT (Kucoin)
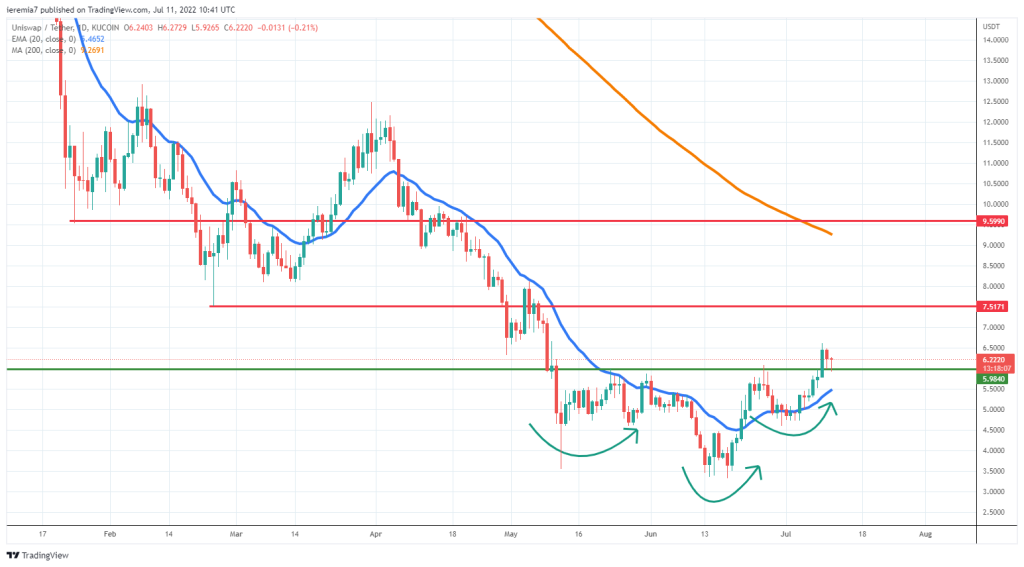
Uniswap is one of the major performers for last week, up more than 25%. Looking at the price, we see a nice head-and-shoulders pattern and now that the neckline around $6 has been breached, it could be possible to see UNI edging higher, toward $7.5 and $9.5, two important areas of resistance.
Outperforming even before Bitcoin or Ether are staging a strong rally suggests Uniswap could accelerate further in case the broad marker sentiment will improve. We need to see a slump below $4.5 in order to negate the current bullish setup, but for now, buyers are eager to buy at the neckline.
The daily 20 EMA has been treated as support at the beginning of this month, a sign that a swift change of hands already occurred. We suspect the move higher can extend towards the daily 200 SMA, where buyers could encounter stronger resistance.
In such a wild market, the bearish scenario should never be ignored. That is why we advise traders to watch carefully how the price unfolds. A break and daily close below the 20 EMA is an early sign of weakness to be aware of.


There are no comments at the moment, do you want to add one?
Write a comment