
BTCUSD (Coinbase)
Source: TradingView
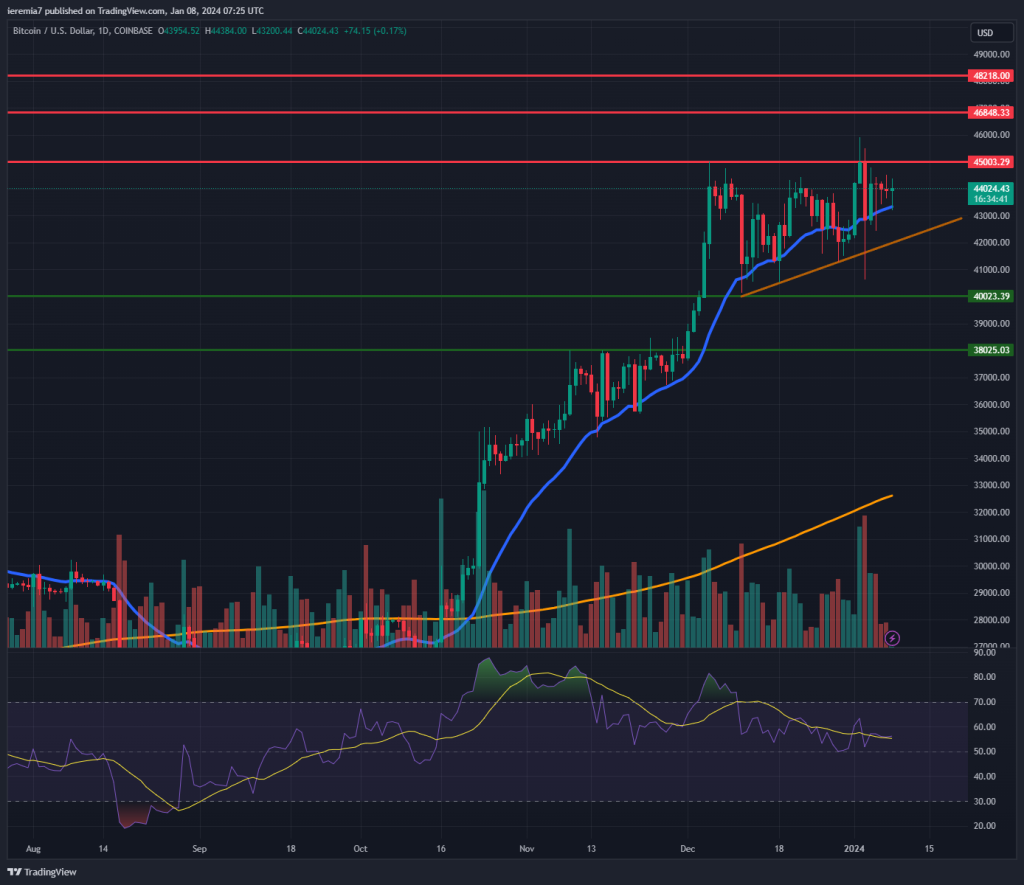
Last week we had a confirmation that markets are heavily focused on the BTC ETF launch. It took only an unconfirmed negative news to plunge by 5%. Still, the uptrend continues to be intact, as the daily chart shows.
You can easily see how the market treats the 20 EMA as a dynamic support. Each time the price touched the blue line and dipped little below it, buyers resumed in full force. Additionally, this looks like a classic pre-breakout squeeze, since the bulls enter at higher and higher levels, pressuring the market close to that key $45,000 resistance.
We favor a breakout on the upside and as a result, $46,800 and $48,200 will be the next key levels to watch. There is a lot of speculation that a US-based ETF will launch around mid-January and we’re getting close to that.
Momentum has been building up for months on this news, which is why we want to caution traders against a buy-the-rumor sell-the-fact scenario. Even though the market could rip in case the ETF announcement finally comes, most of the enthusiasm has been priced in already.
ETHUSD (Kraken)
Source: TradingView
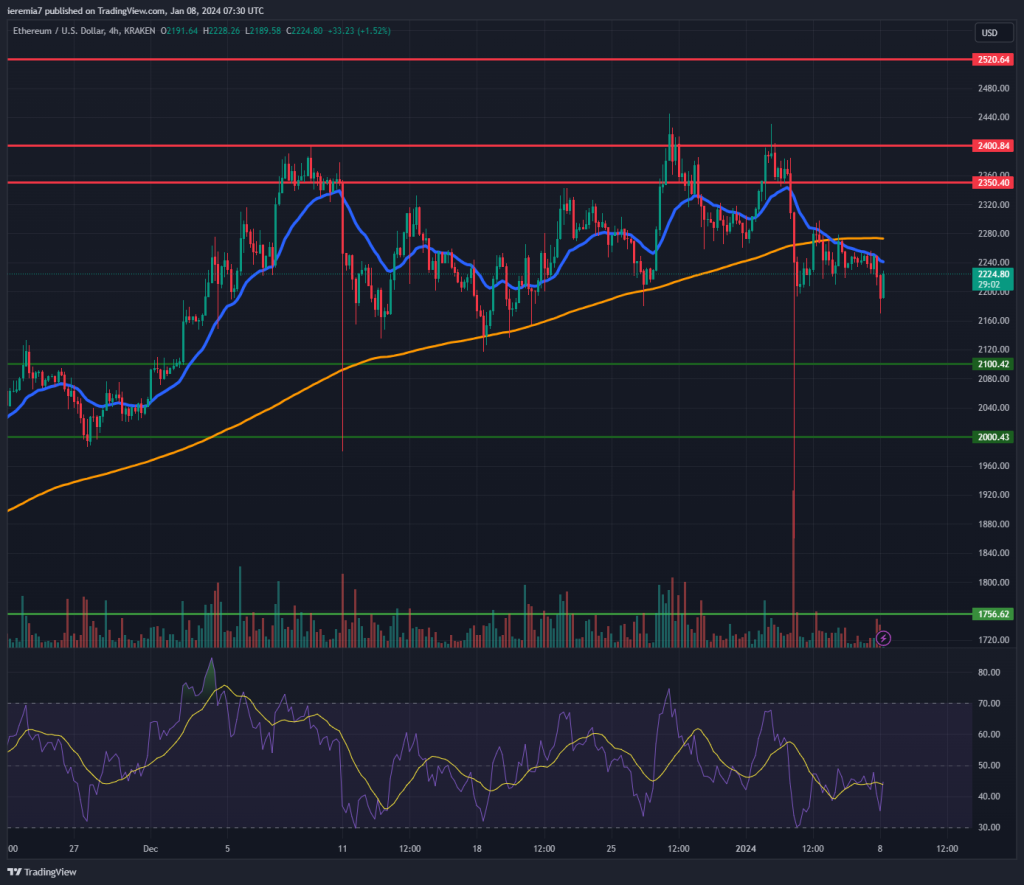
The ETH 4h chart looks a lot messier and the slump witnessed last week drove the market down to $1,850. This market failed to break and hold above $2,400 and that level acted as resistance since December 9th, 2023.
The inability to push the market to new highs is a sign of weakness traders must consider. For the time being, we view this market trapped in a range. On the upside, the key levels to watch are $2,350 and $2,400. Only after we break to a new high, should we start looking at $2,520.
Since the price is trading below the 4h chart 200 SMA, there’s scope for more weakness in the short term. If that will be the case, $2,100 and $2,000 represent the area where bullish pressure is expected to pick up. When the focus is on Bitcoin, Ether generally tends to underperform, until BTC weakness emerges.
ADAUSD (Binance)
Source: TradingView
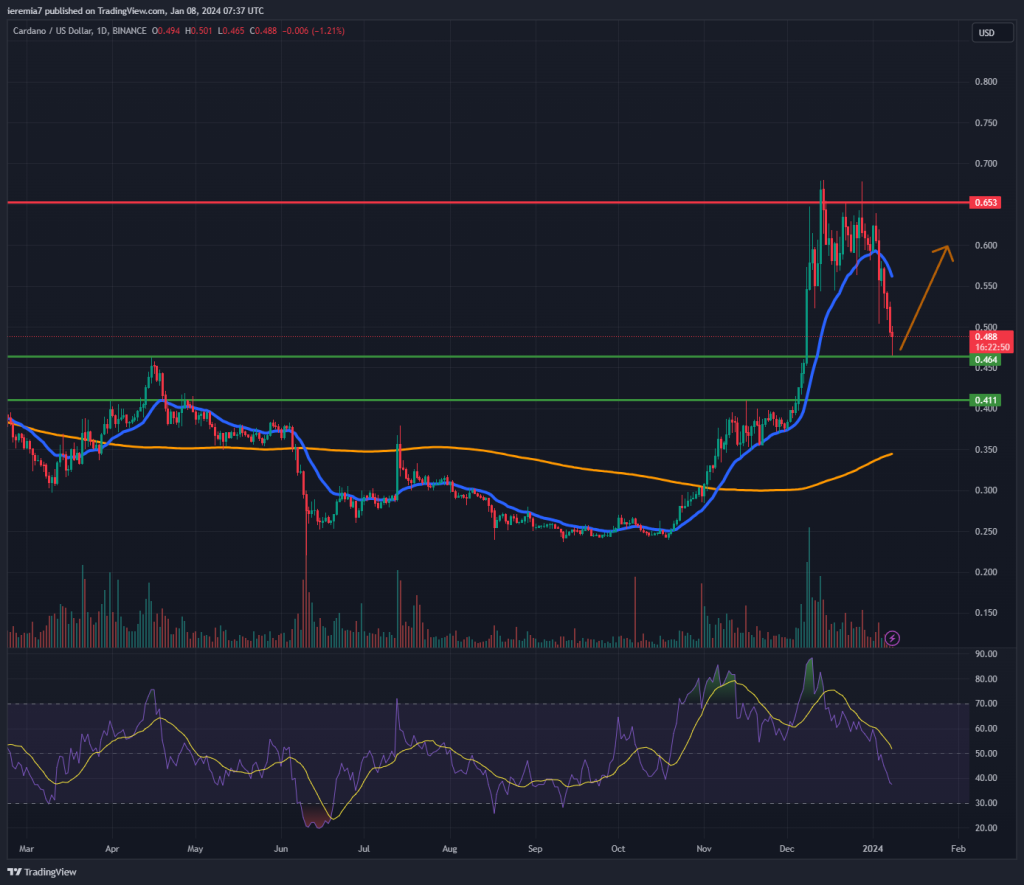
Cardano is one of the major losers, given its price tumbled close to 18% in less than 7 days. Despite a solid push on the upside until mid-December, this coin found heavy resistance around 65 cents. When shifting to a weekly chart, you can see that’s where the weekly 200 SMA is located, so these levels really matter.
Also, as the price fell, where did it find support? Around 46.4 cents, which coincides with a swing high from April 2023. Seeing the market react to that level is a piece of good news for buyers. We view the 46 cents – 41 cents area as a zone of support.
As a result, we suspect the market can bounce higher during the next couple of days. The first hurdle is breaking above the daily 20 EMA. Only after that happens, traders can reconsider a retest of 65 cents. We favor a new leg higher as long as ADA continues to trade above the daily 200 SMA.


There are no comments at the moment, do you want to add one?
Write a comment