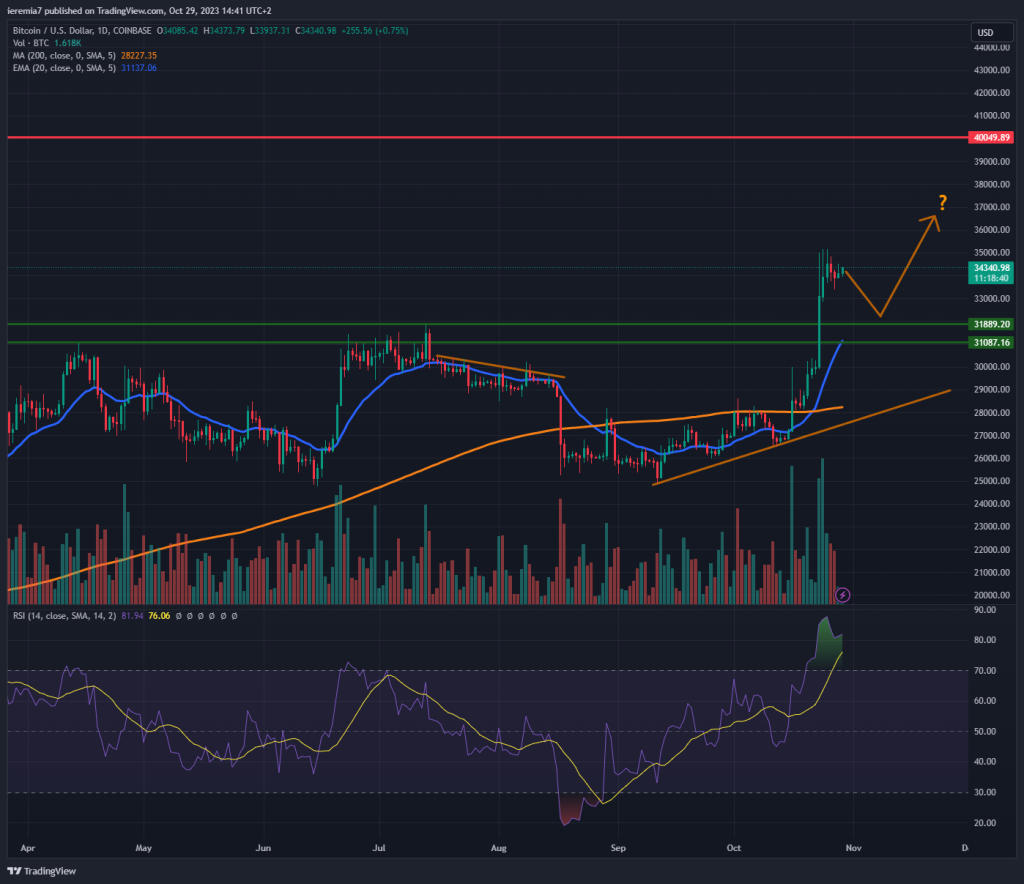
BTCUSD (Coinbase)
Source: TradingView
It has been an impressive week for Bitcoin and that comes although major stock markets slumped. Ironically, BTC was treated as a safe haven, according to the media, during a time of geopolitical unrest in the Middle East. Some say the move is in anticipation of a US-listed Bitcoin ETF.
Regardless, Bitcoin up stocks down is not a good picture and one of these markets is wrong. Also, we don’t view the current price as an ideal technical position to get long. Instead, buyers could stay patient and wait for a pullback. The $32k-$31k is a key support area and that’s where stronger bids could emerge. As long as the structure remains intact, we could see Bitcoin heading towards $40k in the weeks ahead.
Bears might have to wait for further clues of diminishing sentiment. We would like to see the price breaking below the above-mentioned support and the daily 20 EMA. Pay attention to the overbought RSI on the daily chart, which is another sign suggesting a pullback might be healthy for Bitcoin. As long as the market trades above $28k, the sentiment remains bullish long-term.
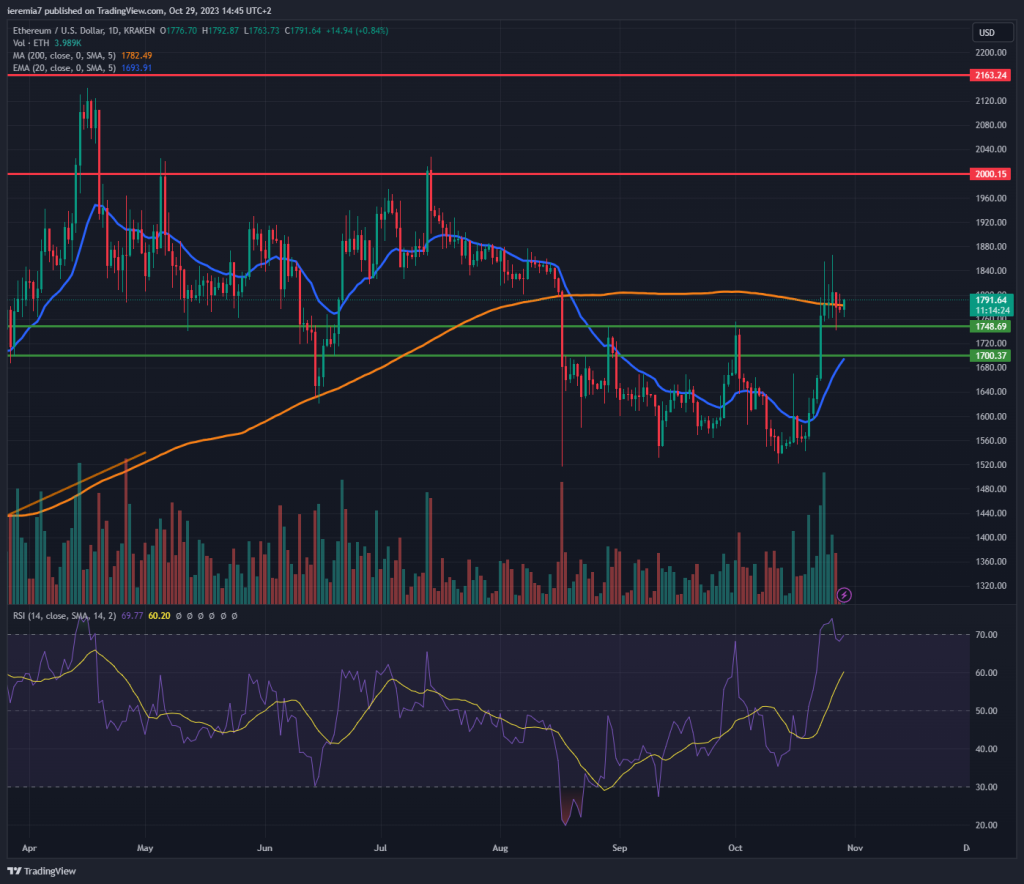
ETHUSD (Kraken)
Source: TradingView
Ether is underperforming Bitcoin by a large since it trades below the yearly highs. However, the price broke above the range we’ve discussed for several weeks and that’s a bullish development on its own. We look forward to seeing ETH breaking above the daily 200 SMA as well because that will be the “clear ahead” sign for buyers.
In that scenario, we expect the price to continue edging up and the next major resistance zone to watch is $2,000. That’s not just a psychological area, but also one where the market reacted multiple times during the first half of 2023.
On the flip side, if we see ETH weakening impulsively below $1,700 again, that would be an early indication that the market could revisit $1,500. The sentiment favors the bulls for now, so you should carefully adjust your view based on how the price action evolves in the upcoming days.
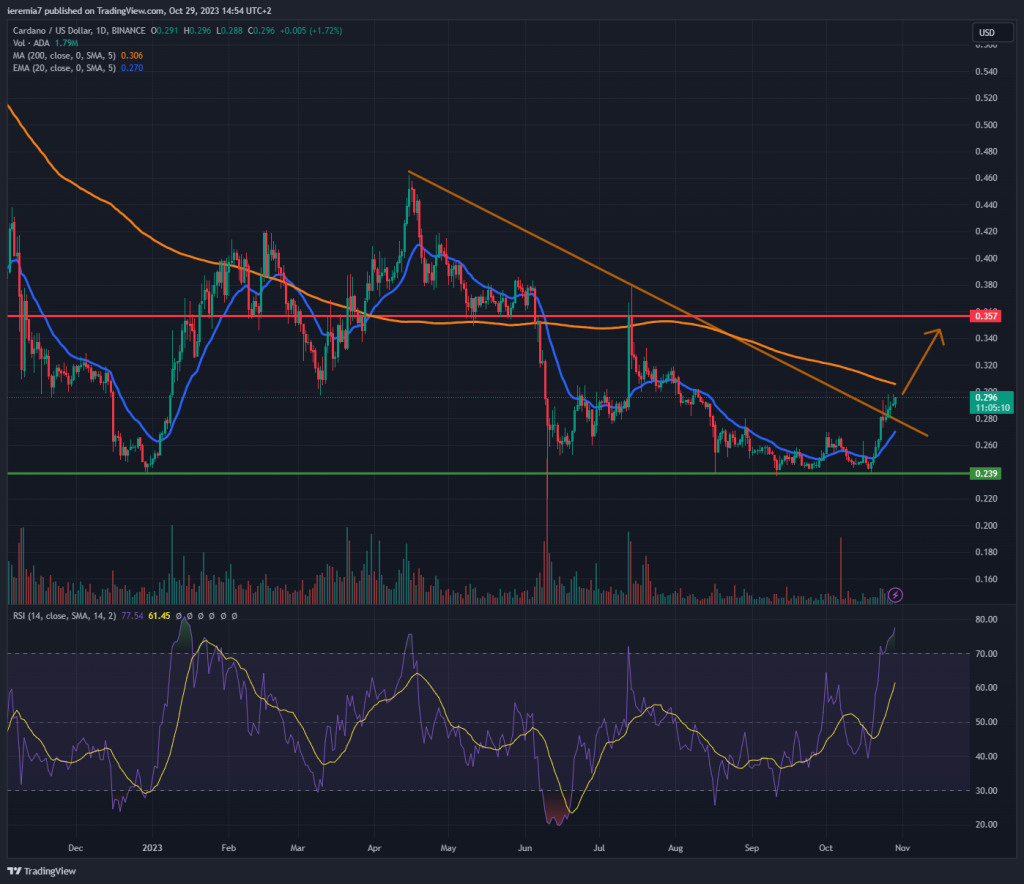
ADAUSD (Binance)
Source: TradingView
Cardano is up almost 15% in 7 days, suggesting bulls have gathered steam. The market broke above a descending trend line that goes back to April 2023 and now there is follow-through buying. Still, pay attention to the daily 200 SMA that’s close to the current price level.
Only if the market clears it out we can fully suggest the sentiment shifted to bullish. If that will be the case, we think ADA can continue to pile up more gains and the first upside target is 35 cents. As things stand right now, it looks like the 24 cents area is where a potential double bottom formed and that means the longer-run upside target is around 75 cents.
Traders should remain cautious because if ADA fails to break above the daily 200 SMA, we could see renewed selling pressure. The 20 EMA should kick in as support if the appetite for buying really is very large.


There are no comments at the moment, do you want to add one?
Write a comment