
BTCUSD (Coinbase)
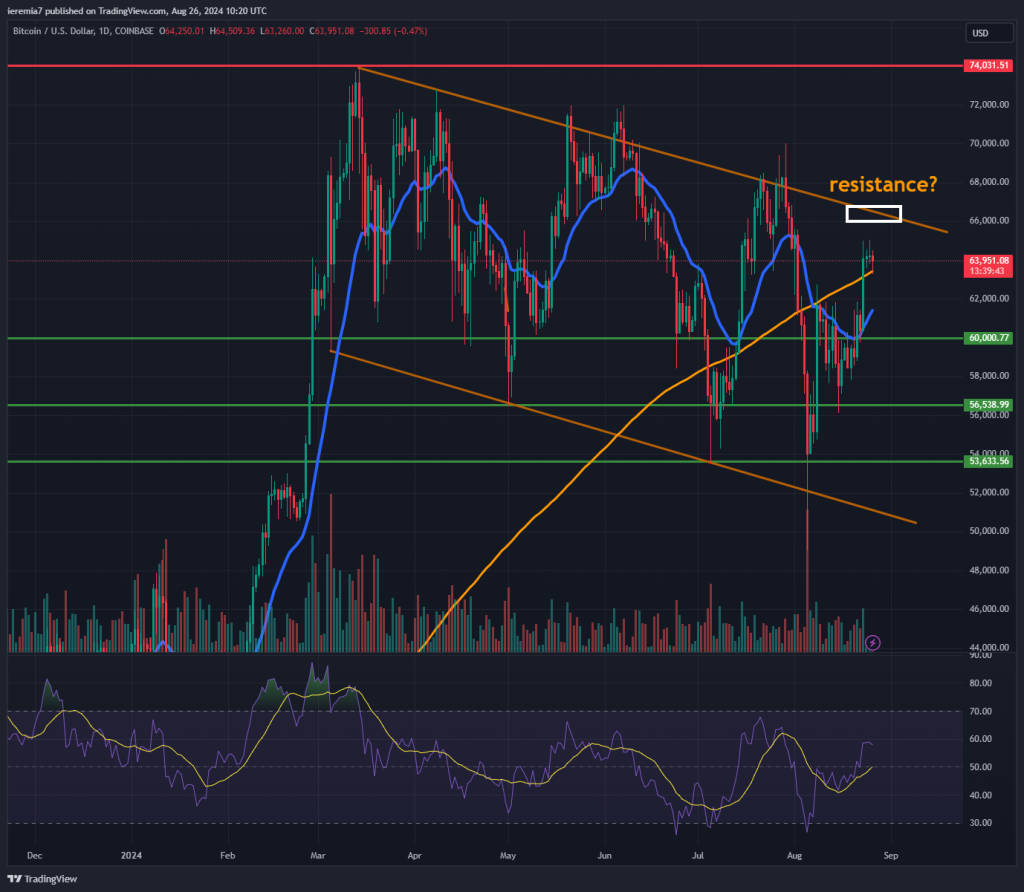
Bitcoin buyers continued to gain some ground last week and as we wanted, the price managed to break and hold above the daily 200 SMA. That seems to be the case so far and suggests the balance has shifted in favor of bulls.
However, looking at our chart above, you can see that BTC continues to trade inside the consolidation structure. The bull trend will resume only if the market clears out the upper line. We see resistance at $66,000 and a strong break above will suggest the price will be headed to the ATH located around $74k.
Usually, the crypto market is driven by momentum, as FOMO traders step in once a break of a critical level occurs. The same could happen again and the move can easily extend to $80k, a bigger resistance level.
We should highlight month-end flows and also the fact that we are entering a period of weakness for risk assets. This will improve later in October, but in the meantime, we could face a couple of bumpy weeks. If BTC is unable to break the structure on the upside, we should see weakness. $60k is the first major support area.
ETHUSD (Kraken)
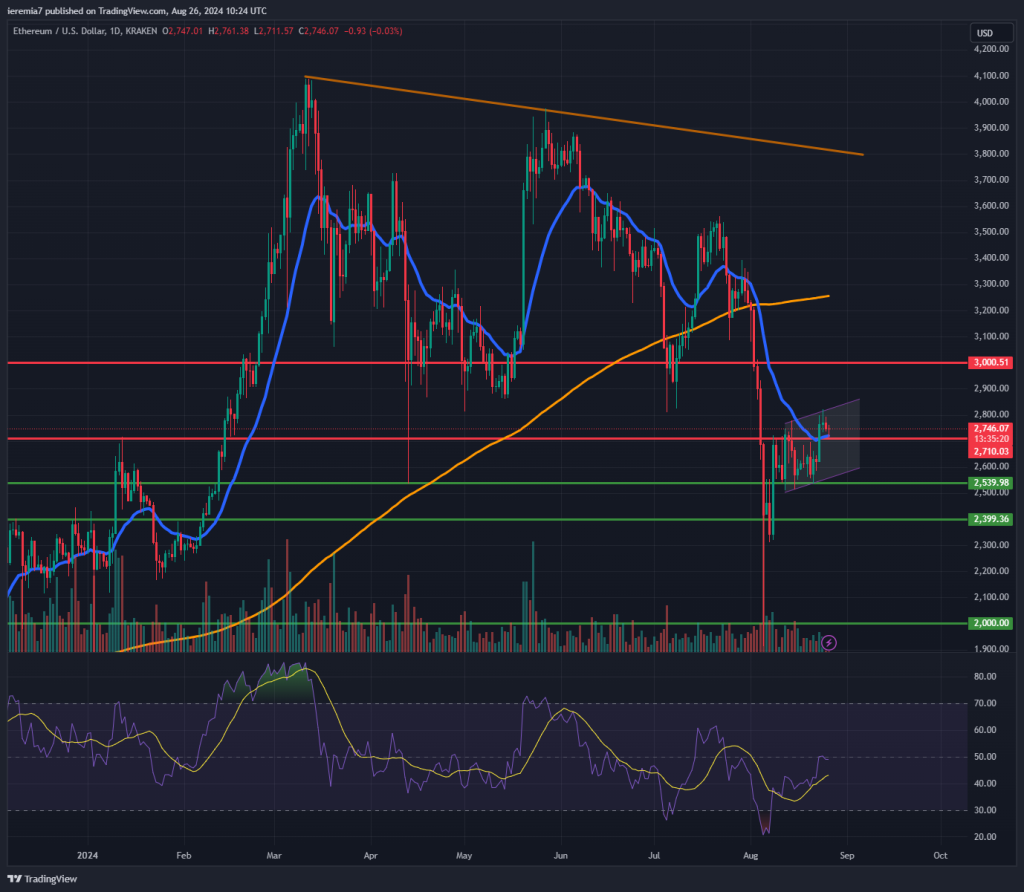
When we look at Ether, the bullish performance is much weaker. The price could barely break above the daily 20 EMA and the 200 SMA is far above at $3,300. We see a pocket of resistance around $2,700 – $2,800, so traders wanting to enter long might need to wait for a pullback first.
To the downside, $2,500 is a decent support area, followed by $2,400. We think the sentiment will deteriorate meaningfully if the market breaks even lower since that will suggest little interest in pushing the price higher.
If ETH continues to sluggishly break to new daily highs, that will be a mildly encouraging sign, but still, the move is vulnerable in the face of impulsive selling. It looks like the market is not happy with the lack of interest in Ether-based ETFs that are now available for trading in the US. If the price continues to extend above the daily 20 EMA then $3,000 is our next major target.
XRPUSD (Kraken)
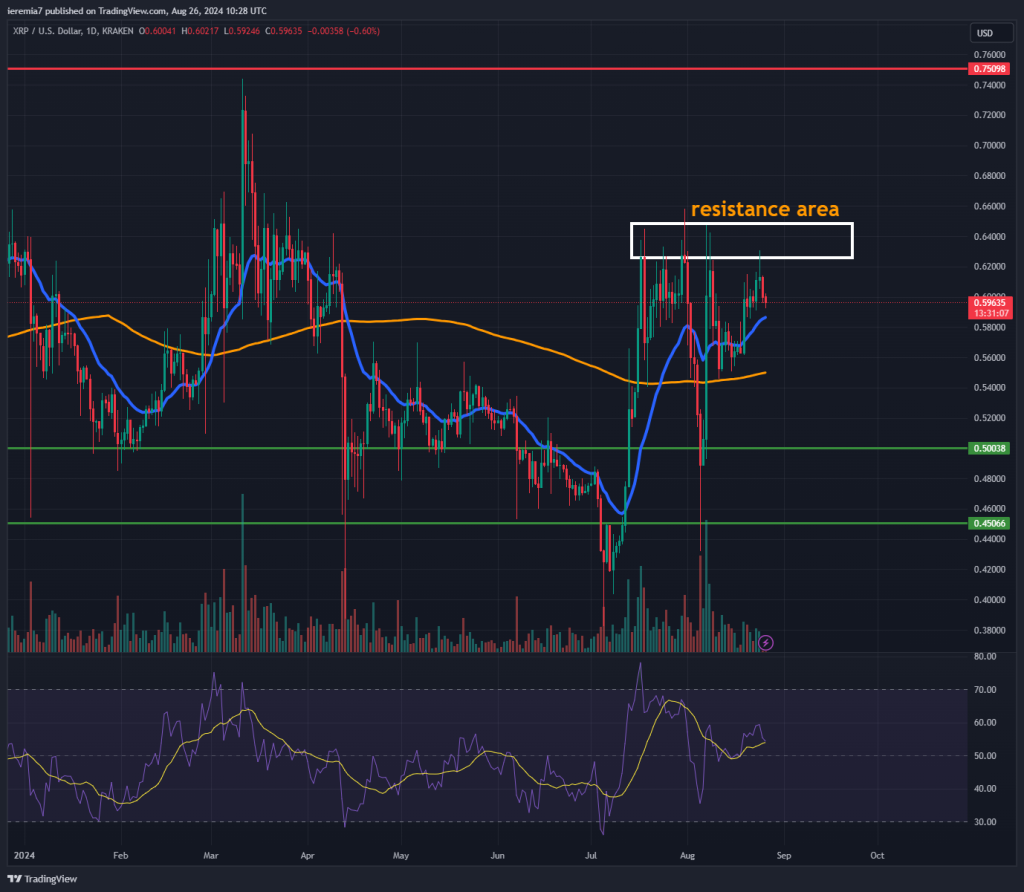
Last time we covered XRP we highlighted the impulsive bullish move and stated that a pullback into the 45-50 cents key support will be a buying opportunity. That’s what actually happened, as you can see from the chart and now the coin is consolidating close to the 60 cents area.
A pocket of resistance looks to have formed around 62-65 cents so we need to see a break above to confirm the move could extend higher. In that scenario, we think XRP can move towards 75 cents, the next major resistance area on the chart.
The inability to do that could bring choppy trading activity and a lack of directional bias. We want to emphasize that could be the likely scenario, at least for a couple of weeks, until seasonality improves for the broker crypto market in October.


There are no comments at the moment, do you want to add one?
Write a comment