BTCUSD (Coinbase)

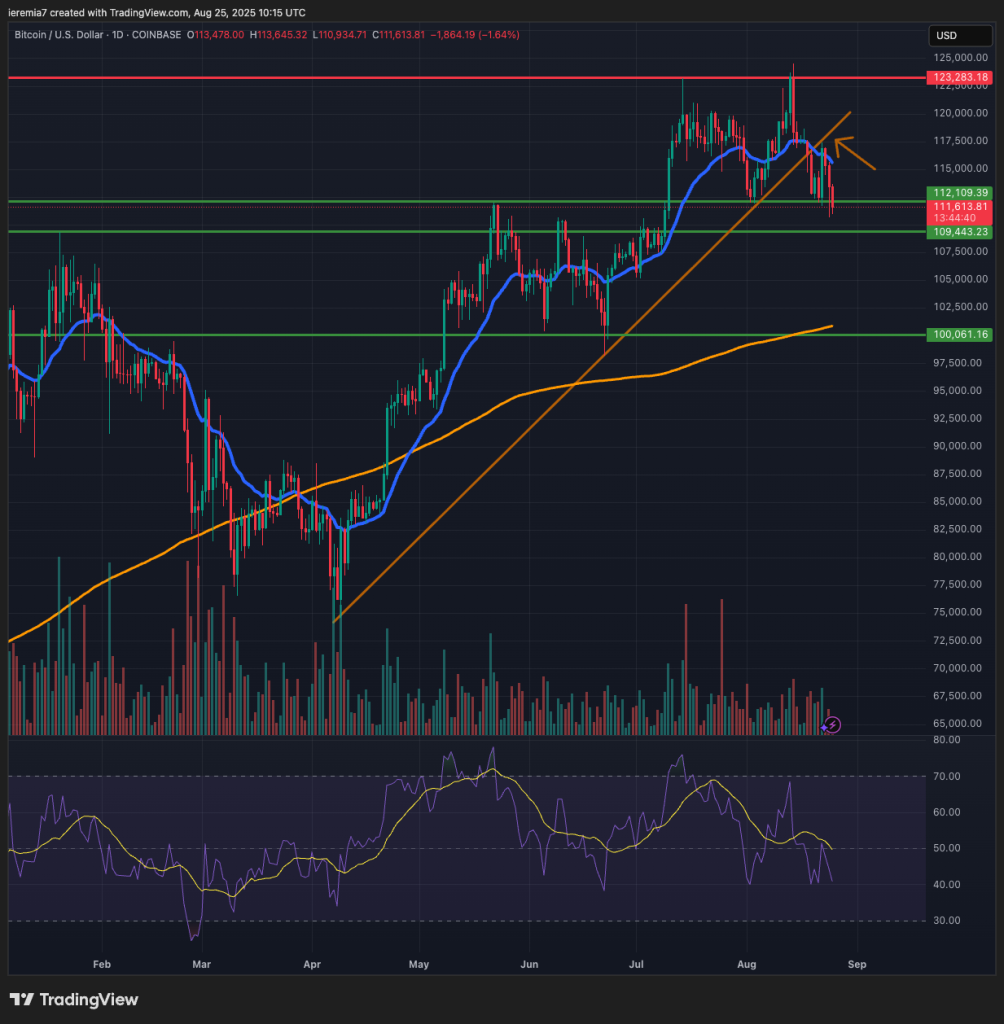
Bitcoin weakness continues as the price is treating the daily 20 EMA as resistance, instead of support. Additionally, we are seeing the RSI heading south towards oversold conditions, suggesting a corrective move is developing.
We expected support at $112k and buyers did step in after enthusiasm flooded the markets in light of the Jackson Hole symposium. However, the buying lasted one day only, which raises concerns on our end.
Buyers should have been able to push the price higher if that was the start of a new bullish leg. For that matter, we think the correction could extend for a couple of weeks, considering the month of September is weak from a seasonal standpoint.
A break below $109.5 will further incentivize sellers and attention should shift to the $100k key area if that materializes. Buyers have to drive the price above $118k to imply a bullish trend resumption. We see how our rising trend line was breached already, which makes us favor sellers, at least in the short term.
ETHUSD (Kraken)

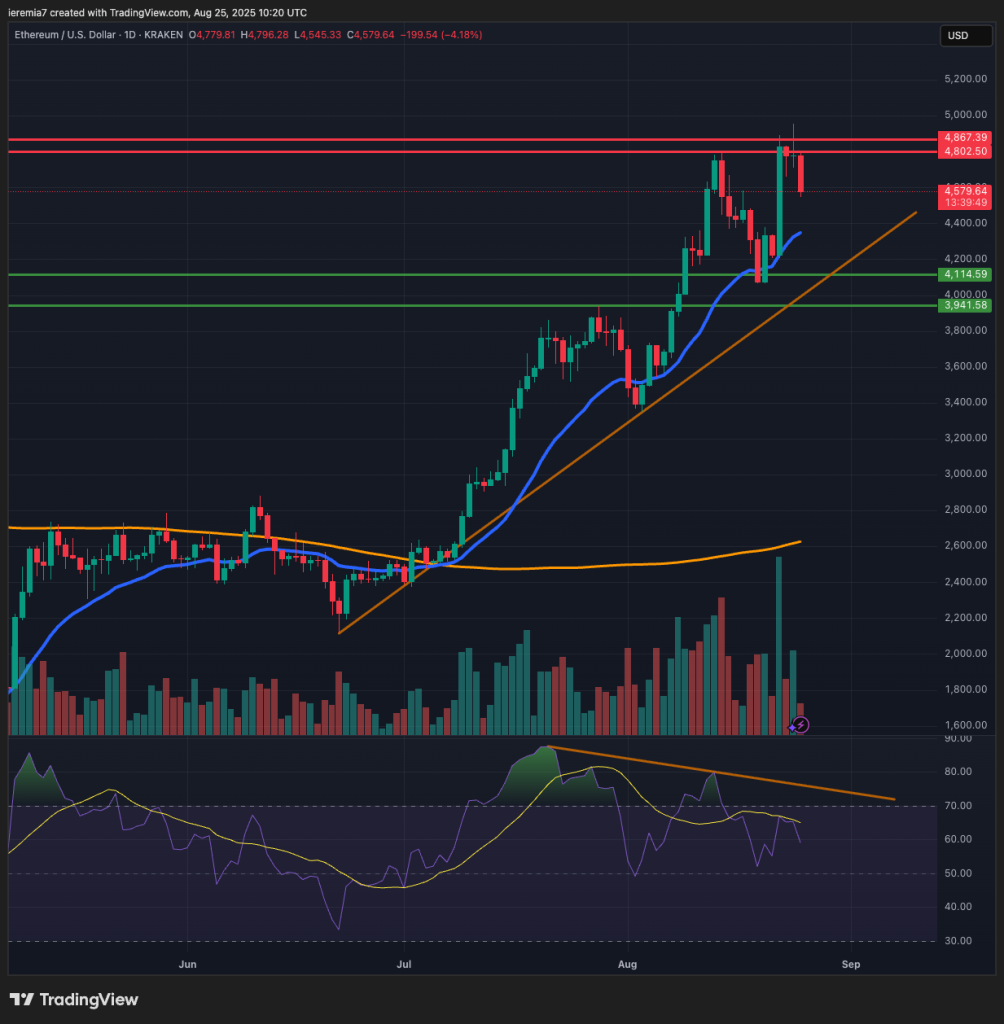
Ether managed to reach an all-time high yesterday, but failed to continue higher. Although this coin is better positioned when compared to Bitcoin, we must consider the inability to sustain those gains.
The $4,860 – $4,800 key resistance area is still valid and that’s where offers should emerge if Ether rises again. We need to break and hold above it on the daily chart to suggest a continuation is the next likely scenario.
Unfortunately, that’s not our best case right now. You can see the divergence between the RSI and the actual chart, which sometimes can act as an early warning for a market turn. We could see a correction into the 20 EMA, or our ascending trend line, before strong buyers resume again.
It will be a bearish sign if Ether breaks below $3,950. That will show a weakening bullish trend and the price action from there could be choppier.
LINKUSD (Kraken)

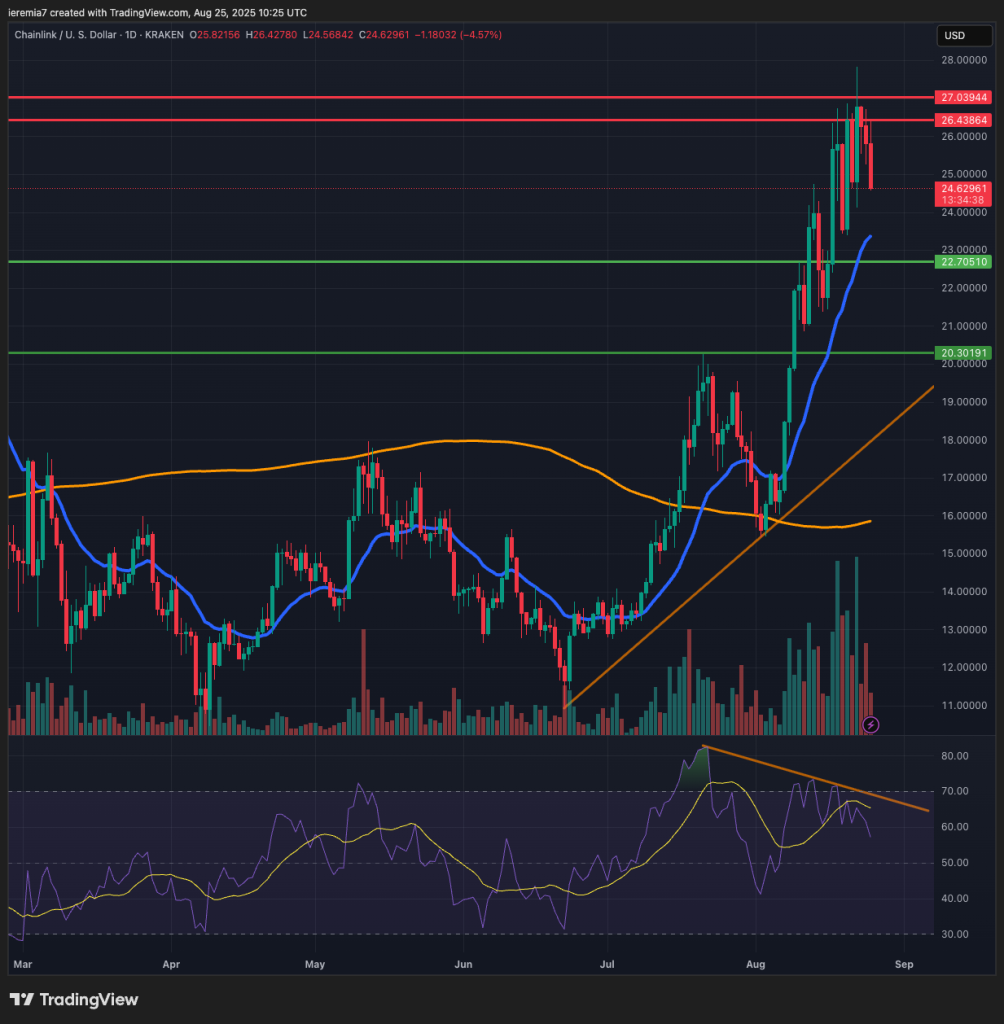
Chainlink is closely correlated with Ether, so it shouldn’t be a surprise to see weakness emerging here as well. Offers emerged once the price broke above the $27 resistance zone and now we suspect the selling could continue until LINK touches the daily 20 EMA.
Once again, we see divergence on the RSI, which is a warning signal. Additionally, the RSI is headed south, suggesting the momentum is weakening. We see support at $22,7 and $20.3. As long as the market keeps trading above those levels, the bullish trend will be intact.
We have to see material break below the trend line on our chart to have a bearish confirmation. Until then, buyers could try and buy dips. Whether or not they will succeed is debatable, since September is usually poor when it comes to crypto performance.
Things could be different this time, as seasonality doesn’t have 100% accuracy. Still, traders wanting to go long should buy dips around key support/resistance levels.


There are no comments at the moment, do you want to add one?
Write a comment