
BTCUSD (Coinbase)
Source: TradingView
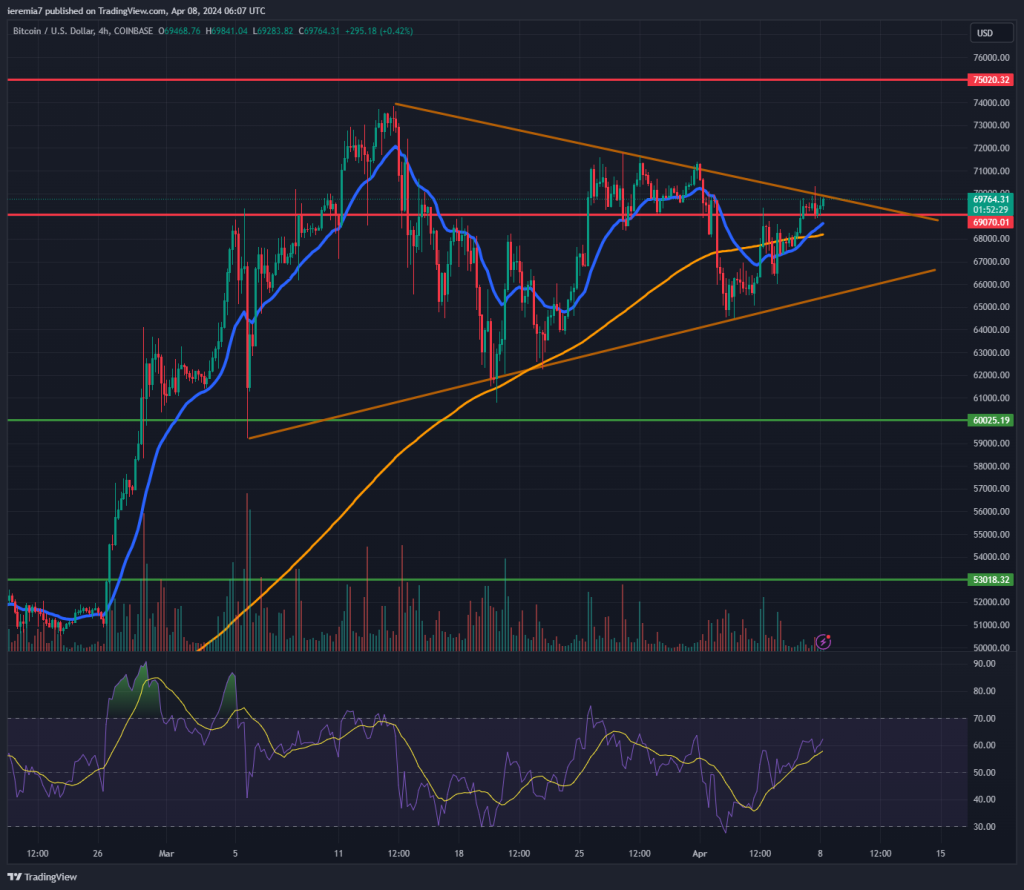
Bitcoin volatility has been compressing for several weeks and as you can see from the chart, the price action is stuck inside a symmetrical triangle. At the time of writing, bulls are pressuring the upper line, yet no breakout occurred.
If it does happen, then our next upside target will be $75k. That could mean a resumption of the bullish trend and it’s possible to see even $80k on the cards by the end of this month. We’re getting close to the well-awaited halving, and volatility will likely pick up.
Traders should follow the market momentum because some of the moves might be wild. Any option is on the table, including a sharp correction lower as a result of “sell-the-fact” flows. In that scenario, we need to see BTC breaking below the 200 SMA and the triangle pattern.
The next likely major support zone will be $60k, followed by $53k. This rally has been relentless and once the FOMO crowd is caught off-guard by a sudden dip, a larger move lower could unravel.
ETHUSD (Kraken)
Source: TradingView
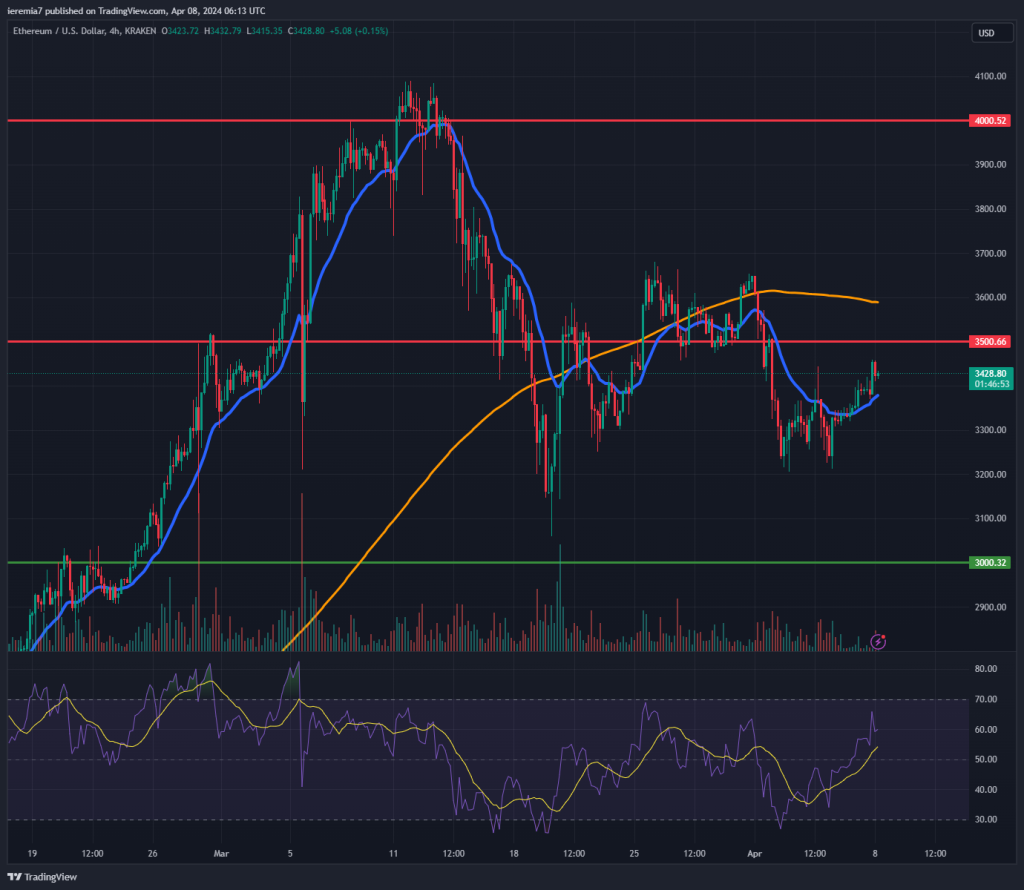
Ether is still consolidating after the mid-March pullback, unable to break above the 4h chart 200 SMA thus far. The bullish momentum is sluggish, based on the price action, suggesting buyers are still waiting on the sidelines for stronger buying to resume.
With that being said, the near-term resistance area is formed by the $3,500 line and 200 SMA. Once the market breaks above and each dip is bought by bulls, we should expect more gains up until the $4,000 area, where the market topped last month.
The current lack of bullish enthusiasm is a sign of caution and we advise traders to be patient until clear setups will form on the chart. One should not exclude a resumption of selling pressure and in that scenario, ETH could move closer to $3,000 a key support zone where larger buyers could be waiting. Until Ether breaks above or below the $3,000 – $4,000 area, we expect choppy trading activity, which should be misleading for some people.
APTUSD (Coinbase)
Source: TradingView
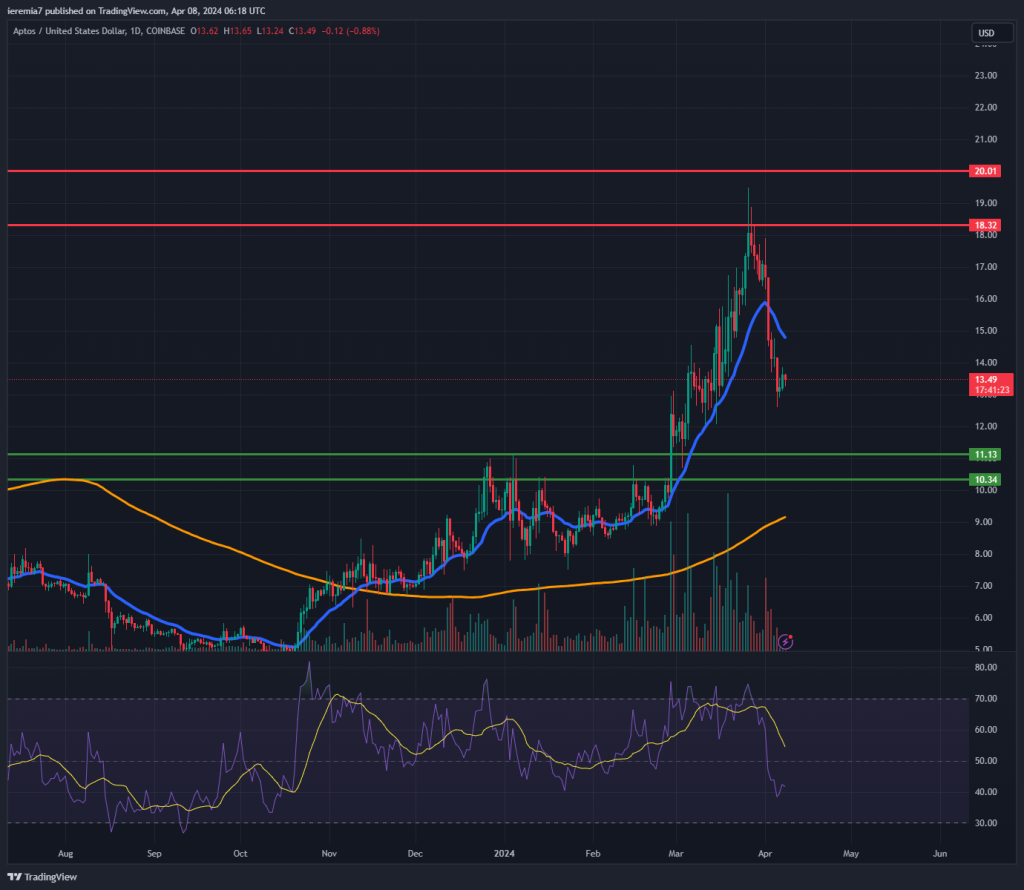
Aptos was down 20% last week, as selling intensified and drove the price well below the daily 20 EMA. This move is impulsive and comes after APT came close to the all-time high. We view the $18.3 – $20 area as key resistance and a hard one to overcome by sellers.
On the flip side, in case selling continues, the first area of support is located around $11.2 – $10.3. We see several swing highs there and the market should treat them as role reversal level. If not, the market attention will shift towards the daily 200 SMA.
Considered the dividing line between bullish and bearish territory, it needs to cap selling and generate a strong bullish response. The RSI retraced from overbought conditions and now there could be some scope for new buys. Aptor is cheaper now compared to a couple of weeks ago so that generally attracts long-term bulls as well. In the short run, however, flows dominate and we can see more selling.


There are no comments at the moment, do you want to add one?
Write a comment