BTCUSD (Coinbase)
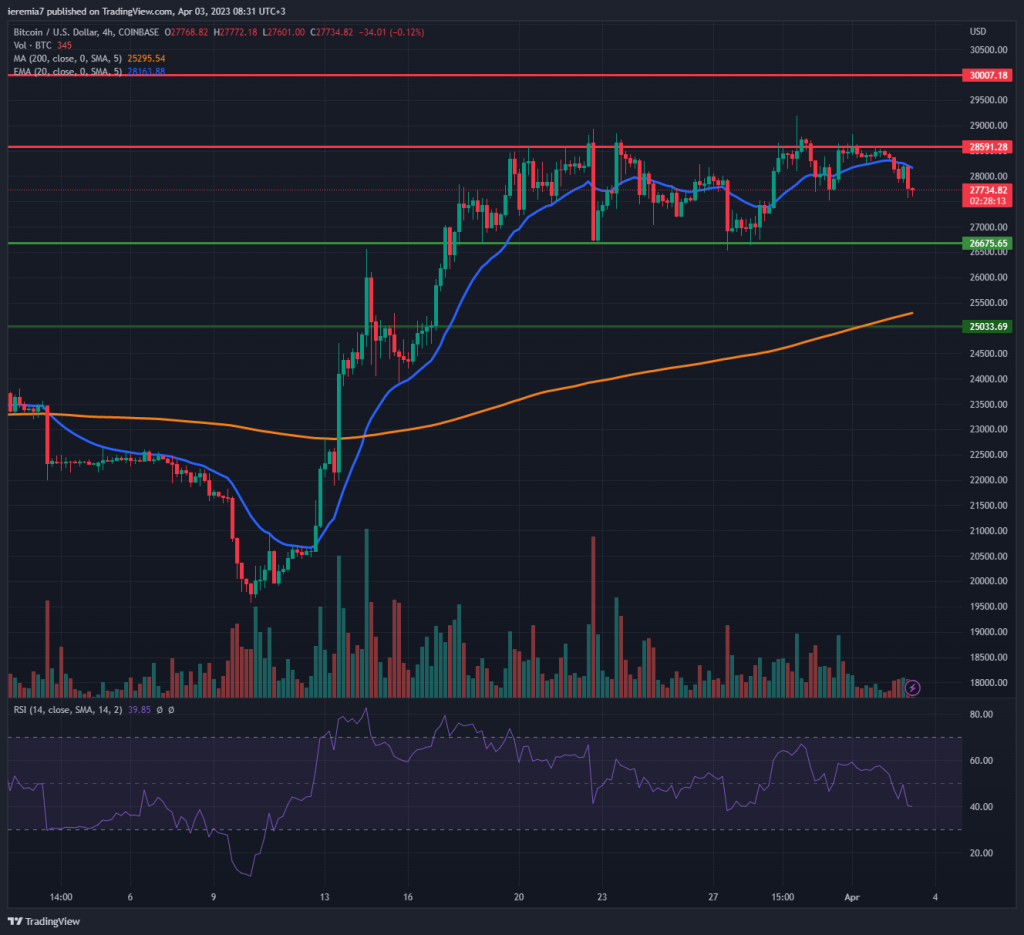
Bitcoin failed to continue rallying and we can see how the $28,600 area acted as a strong resistance. The price is now trading below the 4h chart, RSI is headed toward oversold and volumes have decreased materially. All of these factors point to a more defensive approach from the bulls, which is natural given the impulsive surge seen during the year’s first quarter.
One of the major pieces of news that came out during the weekend deals with the surprise OPEC oil production cut. This could have implications on inflation moving forward and interest rates. Crypto and tech stocks surged in anticipation of lower price pressures, but this could be a game changer.
While below $28,600, we believe BTC can continue weakening. Our first support is at $26,700 and then the 4h chart 200 SMA should follow. Traders need to watch $25,000 in case selling accelerates lower, since a break below it might be indicative of a deterioration of sentiment. Thus far markets seem relatively stable, but things could get volatile as traders get back at their desks.
ETHUSD (Kraken)
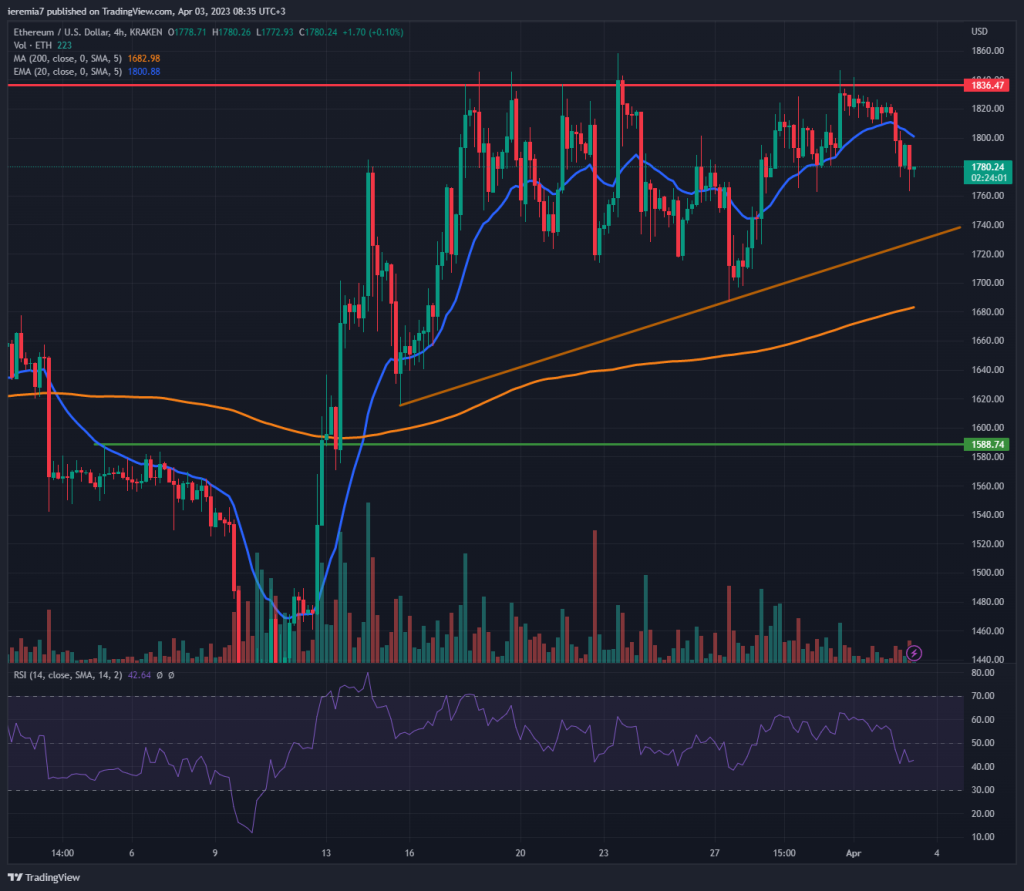
Ether bumped into resistance around $1,840 and failed to break above it. After a few attempts, we can could that’s where sellers drew a line in the sand and are not willing to let the price move further. Given such circumstances, we are slightly bearish while ETH continues to treat that level as resistance.
A short-term trend line kicks in around $1,700, but we believe the 4h chart 200 SMA and then $1,600 are more important support levels to watch. On the upside, a break and hold above resistance will open the door for $2,000 a target we’ve highlighted in the past.
Same as with BTC, the crypto market could enter a wait-and-see mode, in order to assess the implications of higher oil prices. As the West is bracing for the summer activity, when demand for commodities increases, we could see renewed concerns regarding inflation.
XLMUSD (Coinbase)
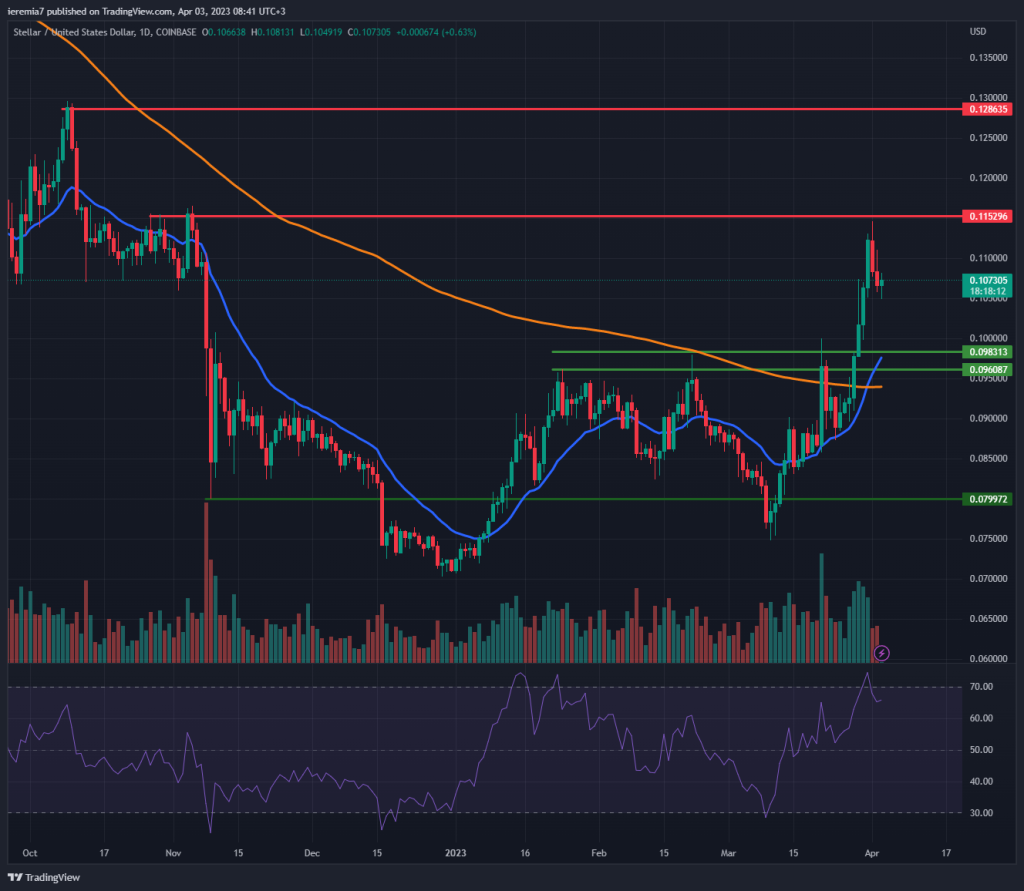
Stellar is one of the popular names that managed to continue higher last week, despite broad market consolidation. When looking at its daily chart, the break above the 9.5 cents area clearly acted as a green light for buyers. XLM was pumped higher but seems to be encountering offers around 11.5 cents, where it started selling off impulsive in November 2022.
We believe that’s the short-term upside cap for this week, as weakness could be spotted across all major coins. A retest of the 10 cents area is what we expect, considering a reversion to the mean usually happens after an impulsive push.
That will drive XLM close to the daily 20 EMA where bulls could place new heavy orders. Buying at current levels is not optimal from a risk management perspective. Waiting for a deeper pullback would be better since you’ll buy the coin cheaper and around key support. If XLM breaks above 11.5 cents, the next upside target is 13 cents.


There are no comments at the moment, do you want to add one?
Write a comment