
BTCUSD (Coinbase)
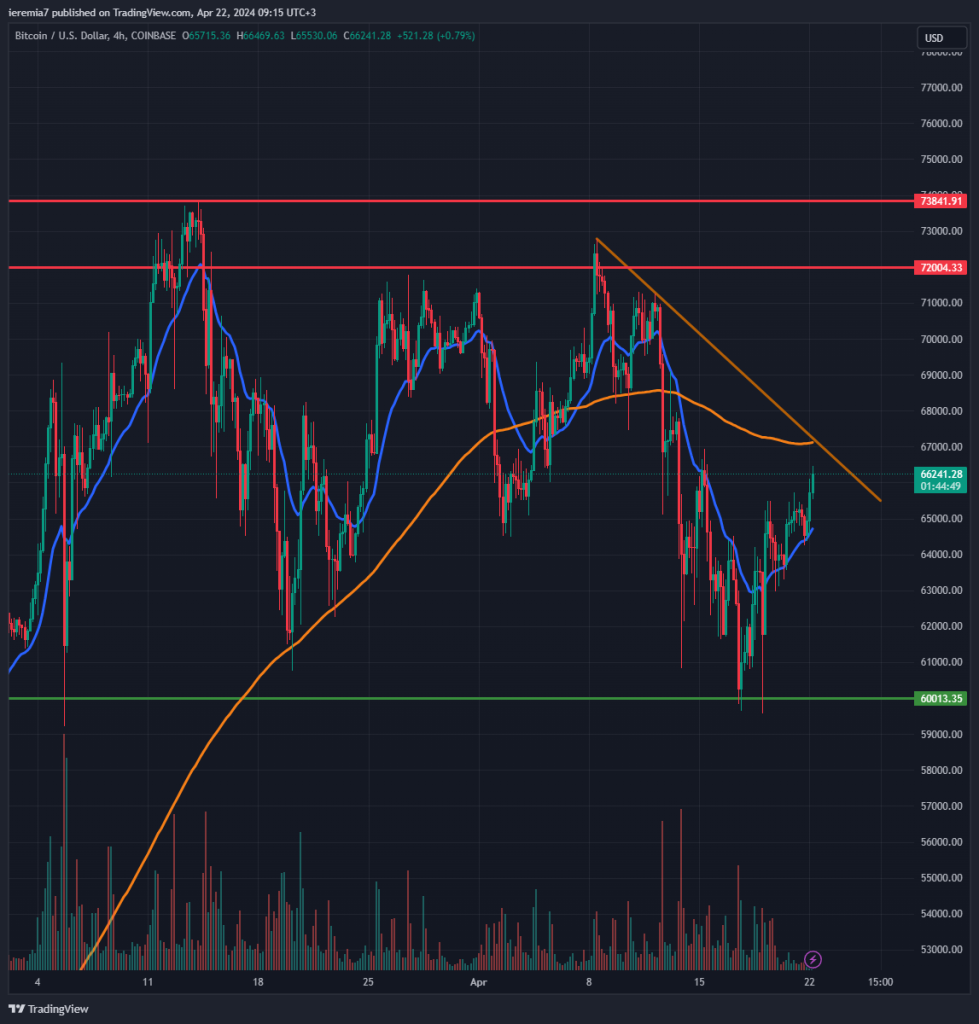
Source: TradingView
The 2024 Bitcoin halving is now behind us and the price seems to be performing well, at least during the last few days. In line with our last week’s projections, the area close to $60,000 acted as strong support, so congratz to those who managed to enter long there.
Still, that doesn’t mean we are out of the woods yet, since the price must break and hold above the 4h chart 200 SMA + a short-term falling trend line you can see on the chart. Only once that happens, we can see the uptrend has resumed and there will be scope for further gains towards $72k and $74k.
Although the momentum is favorable for bulls at this stage, one shouldn’t rule out a bearish scenario. The price bounced off the $60k area impulsively suggesting strong bids at that level. As a result, if the price weakens and threatens to break below $60k again, that will be an early sign for caution.
If the support breaks, we believe the market’s attention will shift to $55k and $50k, two significant levels on the chart. Geopolitical risks seem to have eased, which generally acts as a tailwind for risk assets, including Bitcoin.
ETHUSD (Kraken)
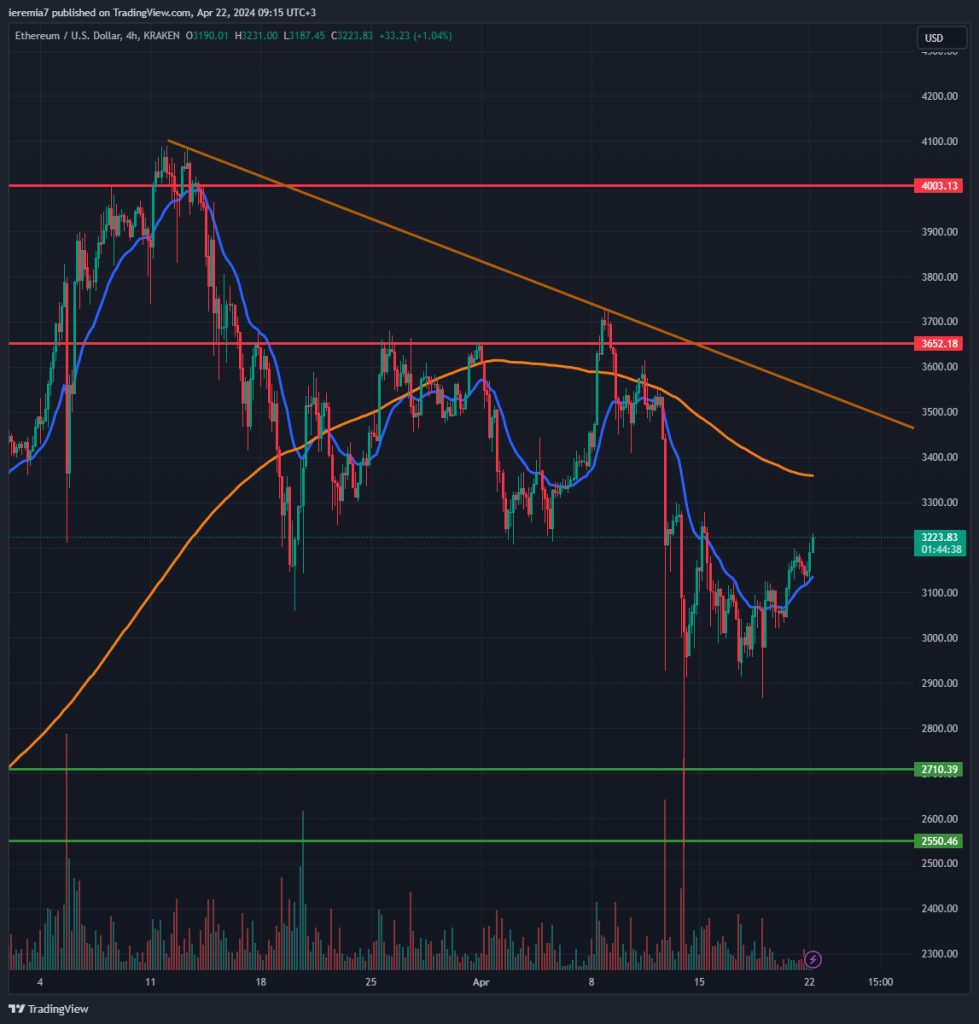
Source: TradingView
Ether is also showing signs of bottoming after a mini flash crash that occurred on April 13th. Buyers managed to push the price above the 4h chart 20 EMA, which is a bullish sign. Sustained buying also suggests new bids are placed at higher levels.
In the broader picture, however, ETH continues to be in consolidation mode. We can see on the chart how the price is below the 200 SMA and also below a falling trend line. There should be a change in the price action structure in order to have a confirmation that the tide has turned.
That will happen on a break and hold above $3,650. If buyers manage to drive the market up and keep the gains, we suspect there could be room for more gains up until $4,000. Such developments might take weeks to unfold, so traders should remain patient.
Given the market is still in a consolidation structure, you shouldn’t rule out short-term selling. Dips should be bought, especially if ETH gets close to $3,000. Breaking below that will be a bearish sign and $2,700 – $2,550 will come into play as the next support area.
LINKUSD (Kraken)
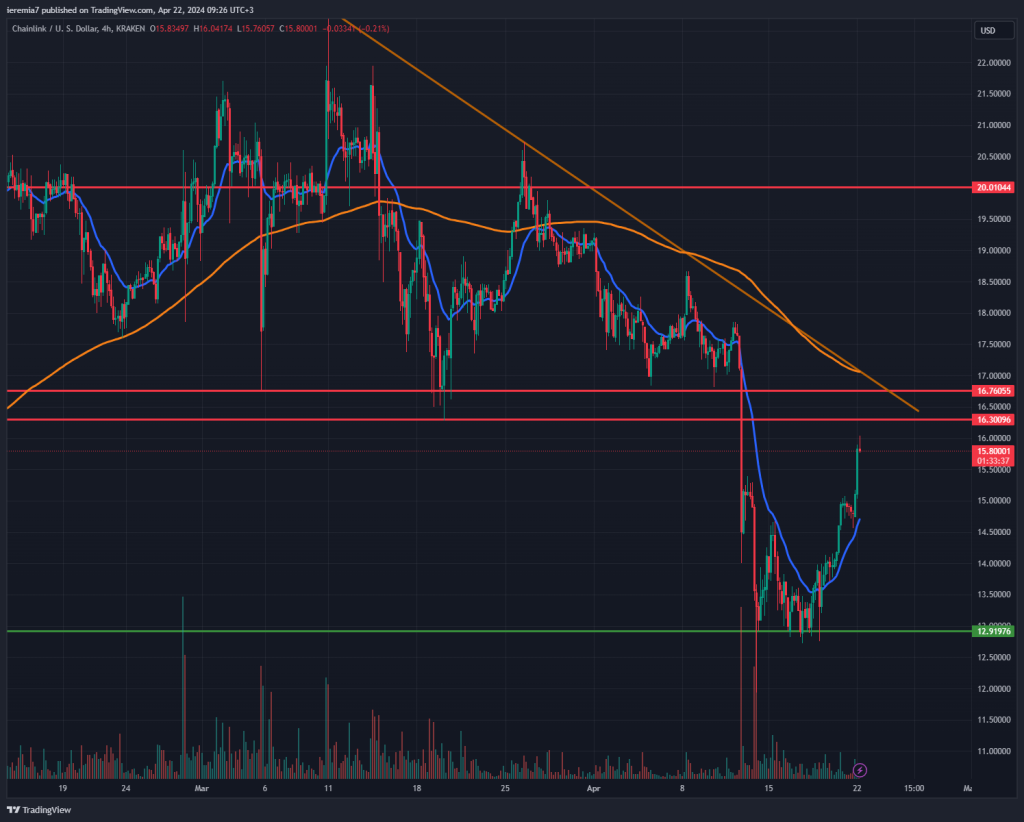
Source: TradingView
Chainlink is also staging a nice recovery, up 10% last week. The price found support a little below the $13 mark and since then there has been only impulsive buying. As we move forward, buyers need to remain cautious because there is a strong resistance zone around $16.3 – $16.8.
The market needs to break impulsively above the 200 SMA + the falling trend line to suggest that the sentiment shifted in favor of bulls. Volatility could pick up around the above-mentioned resistance levels, but we expect the bullish sentiment to persist if no major risk events happen.
As a result, dips should be bought around the 20 EMA on the 4h chart. The area around $15 – $14.5 should be one of interest for those who want to buy LINK at an affordable price.


There are no comments at the moment, do you want to add one?
Write a comment