
BTCUSD (Coinbase)
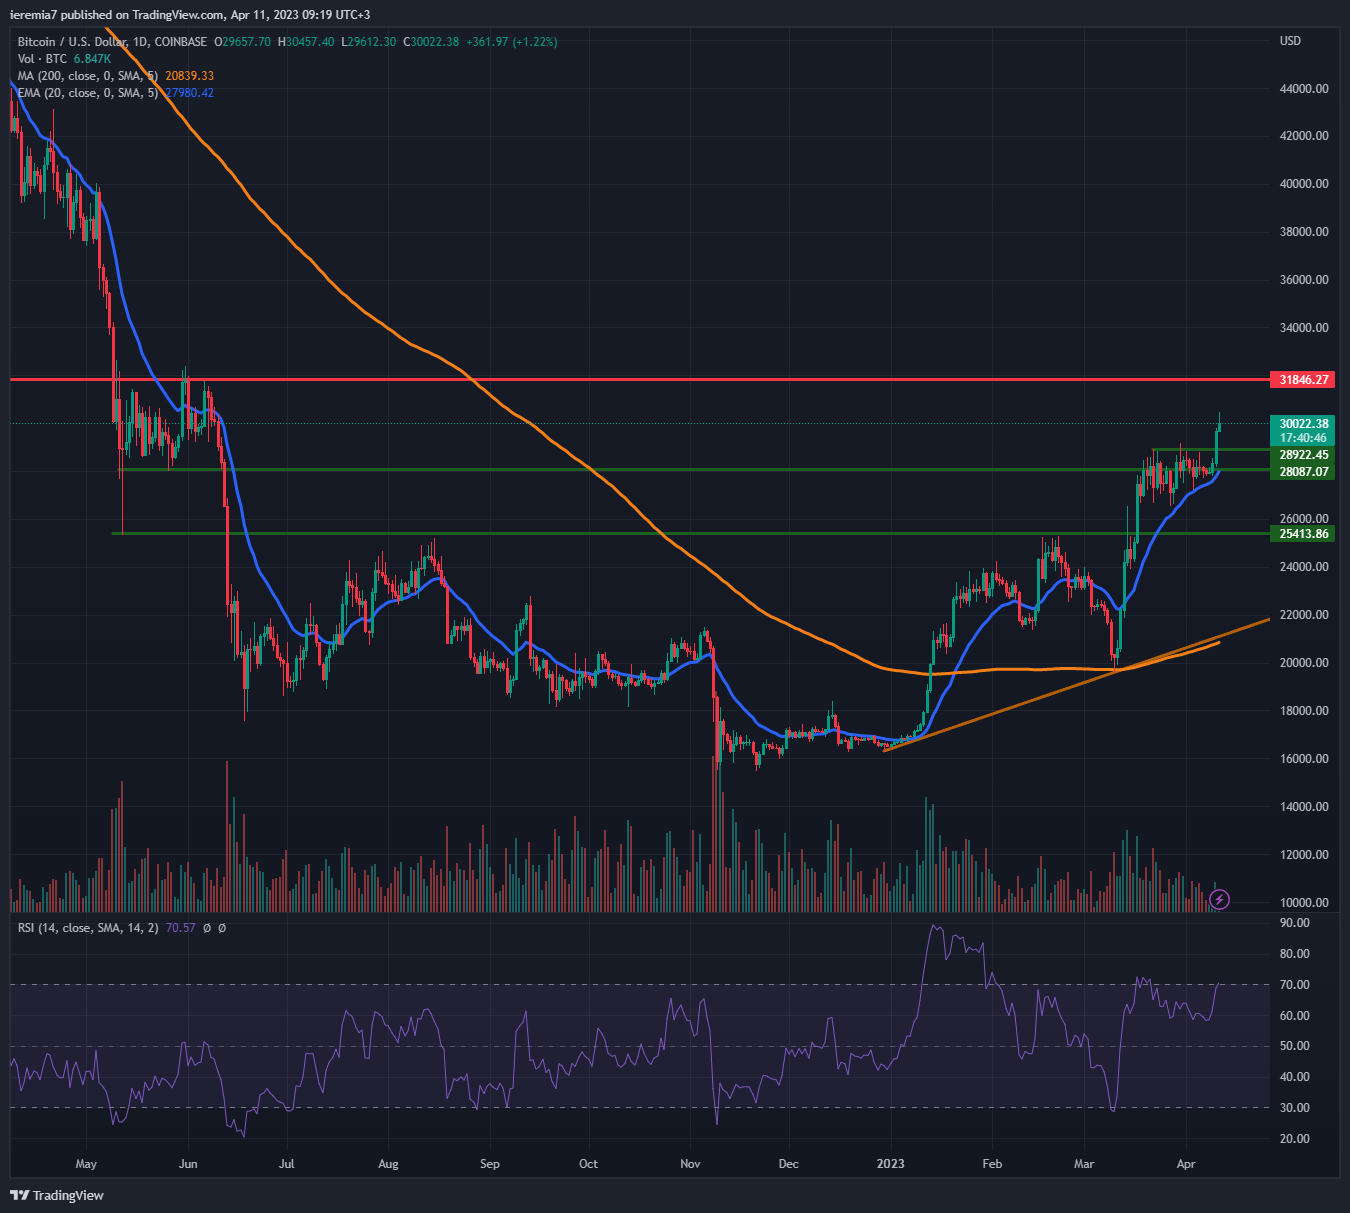
Bitcoin continues to rise and has recently reached the $30,000 key resistance area. A new high for the year is a positive development for buyers and if the price manages to hold above the psychological support, we believe the move could extend a bit higher.
More specifically, we can notice the $31,800 zone as resistance, given BTC retested and then moved sharply lower back in May 2022. Managing to break above unlocks further upside potential and our target will shift toward $35,000.
Technically, the picture favors the bulls, since the price trends above the daily 20 EMA. The RSI is little below the overbought zone and volumes are picking up with traders resuming from the Easter holiday. On the downside, you should watch for support around $29,000 and then $28,000. The 20 EMA and then $25,400 are stronger bullish zone from our point of view.
This looks like a bottoming formation and negating it will require a massive effort from the sell side. Bitcoin should break below the daily 200 SMA and the ascending trend line we’ve drawn on the chart. That’s a lot of ground to cover, which gives the bulls more leverage.
ETHUSD (Kraken)
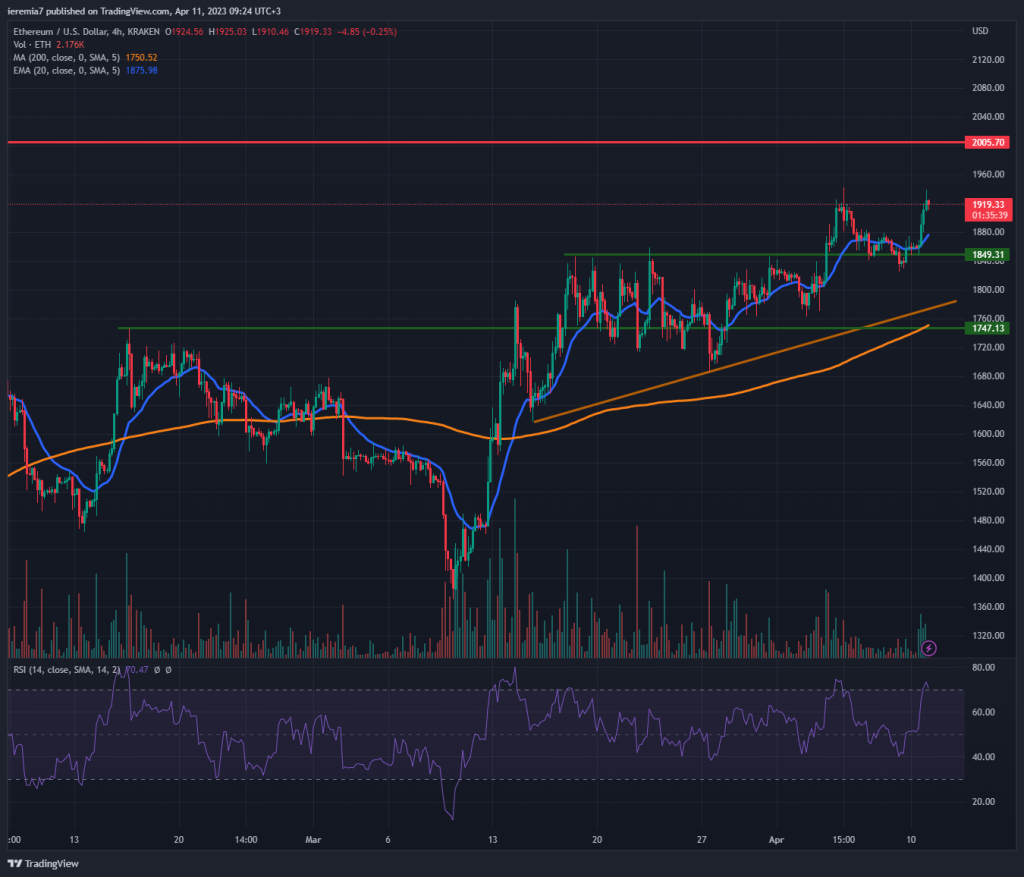
Ether follows BTC’s performance, but we haven’t yet breached above the April 5th high. The sentiment is clearly favoring bulls and based on current conditions, we believe a retest of the $2,000 key resistance zone is on the cards.
That creates some challenges for buyers wanting to increase exposure at this point since the upside looks limited. They could wait for a pullback and enter the market at an attractive level, reducing the downside and improving potential returns.
With that being the case, the 20 EMA on the 4h chart and $1,850 looks like decent support levels. We need to see a break below the short-term trend line and $1,750 to start being worried about sentiment deteriorating. Like in stocks, market participants are frontrunning a peak in the central bank hiking cycle, which leads to positive returns in risk assets.
FILUSD (Coinbase)
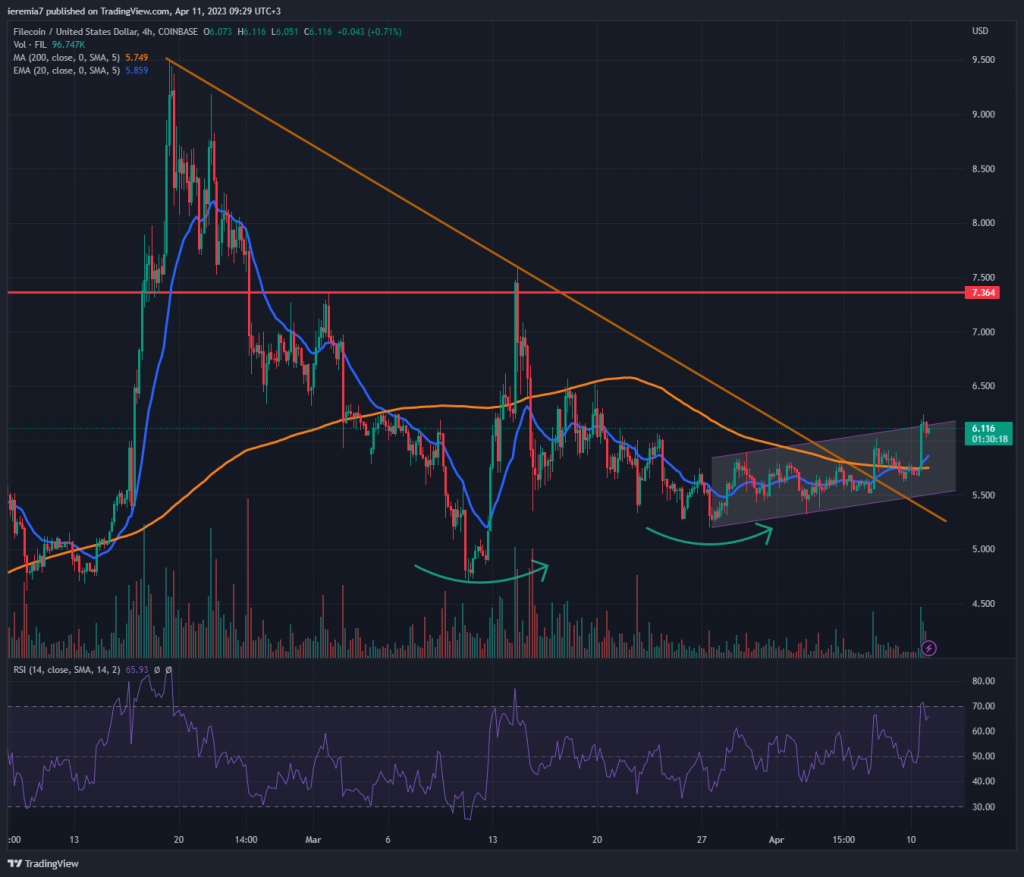
Filecoin posted 10% gains in the last 7 days, making traders more attentive to this project. When looking at the chart, we see two major higher lows and the price developing higher after a breakout above an important bearish trend line.
This suggests a change in market sentiment and strong bids on pullbacks. However, since March this year, FIL has been trading inside an ascending channel and now we are at the upper bound. Breaking outside the channel will suggest strong buying pressure, pushing our upside target towards $7.
The impulsive move up seen last week cleared the 200 SMA and now that should be treated as support. Hence, our view shifts back to bearish only if the price moves below the orange line once again. That seems like the least-likely scenario at this point and we suspect there’s more ground to be covered on the way up if the sentiment continues to stay positive.


There are no comments at the moment, do you want to add one?
Write a comment