Introduction
Bitcoin is once again at the center of global financial attention. After experiencing one of the largest sell-offs in cryptocurrency history, the digital asset has managed to rebound, sparking renewed debate among investors and analysts about its next direction. The correction wiped out billions in market capitalization, erased over leveraged positions, and forced a reevaluation of Bitcoin’s long term resilience. Yet despite the chaos, Bitcoin’s recovery hints at the possibility that its underlying strength remains intact.
The market’s latest behavior reflects the uneasy balance between optimism and fear that often defines the cryptocurrency space. Understanding the technical structure behind this rebound and the external forces influencing it is critical for traders who want to navigate the turbulent landscape ahead.
The Aftermath Of The Sell Off
Bitcoin’s recent collapse was swift and brutal. Within a few trading sessions, its price fell from recent highs above 126000 dollars to lows near 107000 dollars. The speed of the decline triggered widespread panic and forced liquidations totaling nearly 19 billion dollars across futures and margin accounts. Such a massive unwinding of leverage had not been seen since the crash of 2022, underscoring how overheated speculative activity had become.
However, as is often the case in crypto markets, panic was followed by opportunistic buying. Within a short time, Bitcoin managed to stabilize and even rebound toward the 116000 dollar region. Traders interpreted this as a sign that at least some investors were willing to buy the dip. The rebound was notable but still modest compared with the depth of the preceding crash.
The quick recovery revealed two important dynamics. First, while short term traders were liquidated, long term holders appeared more resilient. Second, the technical picture suggested that Bitcoin was entering a critical phase where key price levels would determine whether the rebound was sustainable or merely a temporary pause before another leg down.
Technical Landscape: Patterns And Momentum
One of the most significant technical formations under discussion is the possible triple top pattern. A triple top occurs when the price tests the same resistance level three times without breaking above it, often signaling weakening momentum and potential reversal. In Bitcoin’s case, that resistance area sits near 123000 dollars, which coincides with the upper boundary of its three-month trading range.
This formation suggests that bullish momentum has been struggling to carry the market beyond this ceiling. Each attempt to break higher has been met with strong selling pressure, raising the risk that buyers could exhaust themselves. If confirmed, a triple top could signal a more extended downtrend in the coming weeks.
Bearish Divergence In Momentum Indicators
Adding to the cautionary tone is the bearish divergence visible on momentum tools such as the Relative Strength Index. As Bitcoin made marginally higher highs earlier in October, the RSI failed to follow suit, indicating that upward momentum was weakening. Divergences like this often precede corrections because they show that although prices are rising, the buying strength behind those moves is fading.
Such technical discrepancies often act as early warning signs. Traders who watch momentum indicators closely know that declining strength in these metrics can precede significant pullbacks, especially when combined with heavy leverage in the system.
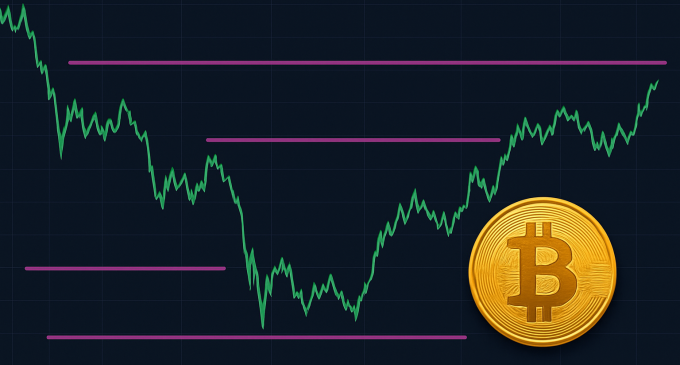
Key Support And Resistance Zones
Major Support Levels
107000 dollars – This is the first crucial level that traders are watching. It aligns with both the 200 day moving average and an important uptrend line that has guided Bitcoin since early 2025. If the price manages to stay above this level, it would suggest that the longer term bullish structure remains intact.
93000 dollars – If the 107000 zone fails to hold, the next potential stopping point lies around 93000 dollars. This level represents a combination of prior swing highs and the lower boundary of the broader accumulation range. A drop to this zone could attract long term buyers looking for discounted entries, but it would also represent a significant deterioration in market sentiment.
Overhead Resistance
123000 dollars – The ceiling that has capped Bitcoin’s rallies for weeks remains the most critical resistance. Multiple rejections here indicate strong selling pressure. Only a decisive break above this mark, accompanied by robust trading volume, would suggest that the bulls have regained control.
139000 dollars – Should Bitcoin break convincingly above the 123000 level, the next major target would likely be around 139000 dollars. This figure corresponds to the projected range breakout target based on the height of the prior consolidation zone.
These zones define the battlefield where buyers and sellers are currently locked in combat. Movements within this range will determine whether Bitcoin’s next big move is upward continuation or a deeper retracement.
Macro And Market Influences
The Role of the Dollar and Global Sentiment
The rebound in the United States dollar has placed additional pressure on risk assets, including cryptocurrencies. Whenever the dollar strengthens, capital tends to flow out of speculative markets, dampening enthusiasm for Bitcoin. Recent relief in trade tensions between the United States and China has stabilized the dollar, creating headwinds for crypto prices.
Liquidity and Leverage Reset
The 19 billion dollar liquidation event has significantly reduced open interest across major exchanges. While this deleveraging may temporarily dampen volatility, it also leaves the market cleaner for potential future rallies. Lower leverage typically reduces the risk of cascading liquidations but can also limit the speed of recovery as fewer traders are willing to take on risk.
Shifting Investor Sentiment
Sentiment in the crypto space has shifted from euphoric to cautious. Retail traders, who often enter near peaks, have become hesitant. Institutional players, meanwhile, appear to be reassessing their allocation strategies. The mix of uncertainty and reduced leverage may cause Bitcoin to trade within a wide but contained range for some time before a clear directional move emerges.
Possible Market Scenarios
Scenario One: Consolidation and Gradual Recovery
In this path, Bitcoin stabilizes above 107000 dollars and begins to slowly grind higher toward 123000. The process may involve several retests of lower support levels, but the broader trend remains constructive. If this occurs, traders could expect a period of sideways consolidation, with buying opportunities near the lower boundary of the range.
Strategically, investors in this scenario would look to accumulate on dips while maintaining stop losses just below key supports. Gradual recoveries often build stronger foundations for future rallies.
Scenario Two: Rejection at Resistance and Renewed Sell Off
If Bitcoin climbs back to the 123000 resistance but fails to break through, sellers could reassert dominance, driving prices back toward 107000 or even 93000. This would fit the bearish triple top narrative and could lead to another wave of capitulation.
Traders anticipating this outcome would be cautious about opening new longs near resistance and may use short term hedges or protective stops. A clear daily close below 107000 would likely confirm that the market has entered another corrective phase.
Scenario Three: Breakout and Rally Extension
The most optimistic outlook involves a decisive breakout above 123000 supported by strong volume and improved sentiment. Such a move could reignite bullish enthusiasm and open the door toward 139000 or higher. For this to happen, Bitcoin would need supportive macro conditions, renewed institutional inflows, and rising on chain activity.
Traders following this scenario would watch for confirmation signals such as large green candles closing above resistance and increasing momentum readings. Risk management remains essential because false breakouts are common in volatile markets.
Risk Factors And Warning Signs
Even in recovery mode, Bitcoin faces numerous risks that could undermine confidence. Among them are:
Failure to Hold Support – A decisive break below 107000 would likely trigger further selling pressure. The next significant support at 93000 would then come into play, but sentiment damage could already be severe.
Weakening Market Breadth – If the broader crypto market, including major altcoins like Ethereum and Solana, fails to follow Bitcoin’s rebound, it could suggest that the rally lacks depth and sustainability.
Renewed Regulatory Pressure – Ongoing scrutiny from financial authorities around stablecoins, exchange reserves, or ETF structures could inject fresh uncertainty into the market.
Macroeconomic Volatility – Interest rate surprises, trade policy changes, or recession fears could quickly shift global risk sentiment, dragging Bitcoin lower in the process.
Profit Taking by Large Holders – If long dormant wallets or large holders transfer Bitcoin to exchanges, it could signal an intention to sell and increase supply pressure.
Each of these elements could transform the current fragile recovery into another round of turbulence if not carefully monitored.
Strategies For Different Market Participants
Long Term Investors
Investors with multi year horizons tend to view major corrections as opportunities. For them, the current pullback may be a chance to accumulate at lower levels. However, prudence is required. Dollar cost averaging and maintaining diversification across asset classes can help manage volatility.
Active Traders
Traders thrive on volatility, but success in the current environment depends on discipline. Short term players may find opportunities near clear support and resistance levels but must use stop losses rigorously. Overtrading or emotional reactions to headlines could lead to unnecessary losses.
Institutional and Whale Activity
Large players often move stealthily. They accumulate positions during periods of fear and distribute during euphoria. The sharp reduction in futures open interest suggests that many institutions have scaled back exposure temporarily. Their reentry will likely signal when the next major uptrend begins.
Broader Context: Bitcoin’s Role In 2025
Bitcoin’s place in the global economy has evolved dramatically. By late 2025, multiple countries had integrated crypto regulation frameworks, and institutional adoption had accelerated through exchange traded products and custody solutions. Yet, the asset remains highly speculative, sensitive to liquidity shifts, and driven by sentiment as much as fundamentals.
The recent crash serves as a reminder that despite growing legitimacy, Bitcoin’s behavior is still governed by market psychology. Fear and greed remain its twin engines. Each major dip shakes out excess leverage and forces a reset, often laying the groundwork for future advances.
Looking Ahead: What To Watch?
In the weeks following the rebound, traders and analysts will focus on several key indicators:
- Price behavior around 107000 and 123000 dollars.
- Trading volume and market participation as Bitcoin approaches these zones.
- Momentum indicators such as RSI and MACD to confirm or reject bullish strength.
- On chain data, including exchange inflows and whale wallet activity.
- Broader risk appetite in traditional markets, particularly equities and currencies.
The confluence of these factors will determine whether Bitcoin’s rebound matures into a sustainable recovery or fades into another correction.
Conclusion
Bitcoin’s journey through the October 2025 volatility has once again tested the conviction of its investors. The digital currency remains above critical support but faces significant resistance ahead. The next phase will depend on whether buyers can maintain momentum and overcome the structural and psychological barriers that halted previous rallies.
While the long term narrative for Bitcoin continues to attract believers, the short term landscape demands respect for risk and attention to detail. Price action around the 107000 and 123000 levels will act as the compass guiding market direction. Whether the next chapter brings consolidation, continuation, or correction, one thing remains certain — Bitcoin’s volatility ensures that its story is far from over.


There are no comments at the moment, do you want to add one?
Write a comment