Introduction
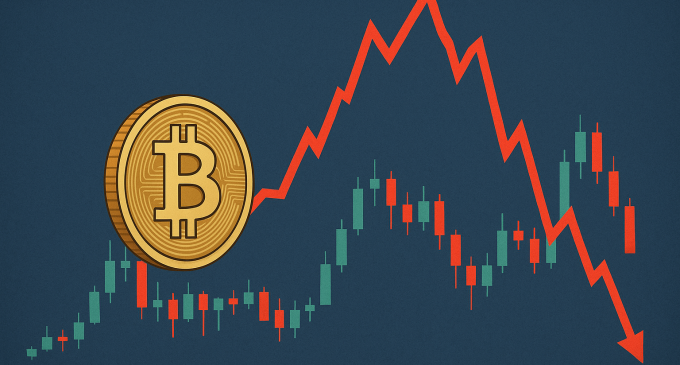
Bitcoin has once again captured the spotlight by maintaining a stronghold above the $118,000 level, a price point that would have seemed like science fiction just a few years ago. While the crypto community celebrates this major psychological milestone, closer inspection reveals that not all is calm beneath the surface. Recent signals from the market suggest that despite the price stability, Bitcoin (BTC) may be showing signs of fatigue. Analysts, traders, and blockchain data are collectively indicating that a correction or at least a pullback could be on the horizon.
This article delves into the multiple dimensions of the current Bitcoin market: its price dynamics, structural weaknesses, on-chain activity, market sentiment, and what investors can expect over the next few months. Drawing from the insights provided by CCN, CoinDesk, AMBCrypto, Barron’s, and Bitcoin.com News, we will analyze both technical and macroeconomic indicators to better understand the landscape shaping Bitcoin’s near-term trajectory.
Bitcoin Price Overview: Holding Steady At $118,000
As of late July 2025, Bitcoin is trading comfortably around $118,000, continuing a strong upward trend that began in the first quarter of the year. This level represents a significant gain from the sub-$70,000 zone it occupied in early 2024. Several key factors contributed to this price rally: institutional adoption fueled by Bitcoin ETF approvals, increased global inflation hedging, and broader investor interest in cryptocurrencies as a store of value.
However, what appears to be solid footing may not be as secure as it seems. Analysts warn that the current market structure shows vulnerabilities. For instance, data from blockchain analytics platforms indicate a substantial rise in leveraged long positions, particularly on derivatives exchanges. These positions, while reflective of market confidence, can also act as a destabilizing force during even minor corrections.
Technical Weakness: The Role Of Leverage And Volume
According to the CCN article published on July 28, 2025, one of the more pressing concerns in the Bitcoin market is the overdependence on leveraged long positions. In practical terms, this means that many traders are betting on Bitcoin’s continued rise using borrowed funds. While leverage can amplify gains, it also increases risk exponentially. Should the price of BTC drop even modestly, it could trigger a wave of liquidations, causing a cascading effect that drags prices down sharply.
Another indicator pointing toward potential instability is the recent drop in trading volume. Bitcoin.com News highlighted this trend in its July 28 report, noting that although the uptrend remains intact on paper, volume has steadily declined over the past two weeks. This type of divergence — rising prices with falling volume — often precedes a reversal or at least a consolidation period. It suggests that buying pressure is not strong enough to sustain the current price level indefinitely.
The Psychology Of The Market: Sentiment And Fear Indexes
Beyond the charts and candlesticks, the psychology of investors plays a crucial role in Bitcoin’s performance. Sentiment indicators currently show a mixed bag. On one hand, retail investors are increasingly optimistic, with Google Trends data showing spikes in searches for “Bitcoin to $200K” and “how to buy Bitcoin ETF.” On the other hand, the Fear and Greed Index, a popular sentiment gauge, has moved from “Extreme Greed” to a more cautious “Neutral” territory within the past week.
This shift could signal growing unease, especially as global macroeconomic uncertainty looms large. Investors are wary of potential interest rate adjustments by the U.S. Federal Reserve and geopolitical tensions that could disrupt financial markets. In such an environment, Bitcoin’s role as a hedge can be both a strength and a vulnerability, depending on the prevailing sentiment.
Expert Outlook: Is A $200,000 Target Realistic?
Various analysts remain bullish on Bitcoin’s long-term potential despite short-term concerns. In a detailed forecast published by AMBCrypto on July 27, the platform explored multiple pricing models that estimate Bitcoin reaching as high as $200,000 by mid-2026. These models are grounded in assumptions about increased institutional inflows, the limited supply of Bitcoin, and continued interest in decentralized finance.
Barron’s took a more aggressive stance, citing analysts from Cantor Fitzgerald who argue that Bitcoin could even reach $1 million under the right conditions. While this projection certainly captures headlines, it’s worth noting that such estimates depend on ideal circumstances aligning perfectly: continued ETF momentum, favorable regulation, and macroeconomic tailwinds that drive investors away from traditional assets and into digital stores of value.
Yet these projections must be weighed against present realities. For example, if the current leverage-heavy market structure collapses, it could delay any price targets significantly, causing panic selling and a reevaluation of market assumptions.
On-Chain Metrics: Whale Activity And Exchange Flows
Blockchain analytics provide valuable insights into investor behavior. Recent data indicates that “whales” — wallets holding more than 1,000 BTC — have begun transferring their holdings to exchanges. This is often interpreted as a prelude to selling, especially when it coincides with price peaks. Conversely, retail addresses continue to accumulate small amounts of BTC, a phenomenon known as “stacking sats.”
Meanwhile, net exchange flows have shifted from negative (indicating accumulation) to positive over the past five days. This subtle shift may signal a turning point in sentiment, where investors prepare to offload some of their holdings in anticipation of a correction.
The on-chain data reinforces the idea that while Bitcoin’s price is stable at the surface, the market underneath is anything but. These undercurrents could create significant price movements if triggered by a sudden event or macroeconomic shift.
Institutional Impact And ETF Dynamics
The influence of institutional investors has grown considerably over the past two years. The launch of multiple spot Bitcoin ETFs in the U.S. and Europe has introduced new liquidity into the market. However, this influx of institutional capital also comes with new risks. Institutions tend to operate with stricter risk-management protocols and may exit positions quickly if volatility spikes, creating sharp downward momentum.
Furthermore, ETFs are sensitive to broader market movements. If the stock market faces a correction, it is likely that Bitcoin ETFs could see outflows as investors rebalance their portfolios toward less volatile assets. This could add downward pressure on BTC, especially if such actions are mirrored across multiple funds.
Macroeconomic Crosswinds: What Could Shake The Crypto Ship?
Bitcoin does not exist in a vacuum. Macroeconomic forces such as interest rates, inflation, currency strength, and regulatory decisions all play a role in its performance. The Federal Reserve is expected to announce another policy update in August, and any hints of hawkish behavior could rattle risk assets, including Bitcoin.
At the same time, geopolitical tensions in Asia and the Middle East could create unpredictable reactions in financial markets. In times of crisis, Bitcoin has occasionally acted as a hedge, but its track record is mixed. If markets perceive Bitcoin as a risk-on asset, it could be among the first to fall in a global risk-off event.
Looking Ahead: What Investors Should Watch?
Given the complex web of factors at play, what should investors look out for in the coming weeks?
First, keep a close eye on trading volume. If price continues to rise without volume support, a pullback is increasingly likely. Second, monitor liquidation levels on major exchanges. Rising liquidation numbers, particularly on the long side, could signal a breakdown. Third, track on-chain movement, especially whale transfers and net exchange flows, as these provide early warnings of large selling activity.
Technical levels to watch include the immediate support near $114,500 and the resistance at $122,000. A break below the support zone could open the door to deeper corrections toward $108,000 or even $100,000. Conversely, a surge in volume above $122,000 could invalidate the bearish case and push Bitcoin toward its next milestone at $130,000.
Conclusion
Bitcoin’s current price of $118,000 is a remarkable achievement in its journey as a digital asset. However, as this analysis has shown, price alone does not tell the full story. Underneath the surface, there are signs of strain — declining volume, leveraged long positions, whale transfers, and shifting investor sentiment — that may lead to volatility in the near term.
While long-term fundamentals remain strong and institutional adoption continues to grow, the short-term picture is one of caution. Investors would be wise to monitor the technical and macroeconomic landscape carefully before making aggressive moves.


There are no comments at the moment, do you want to add one?
Write a comment